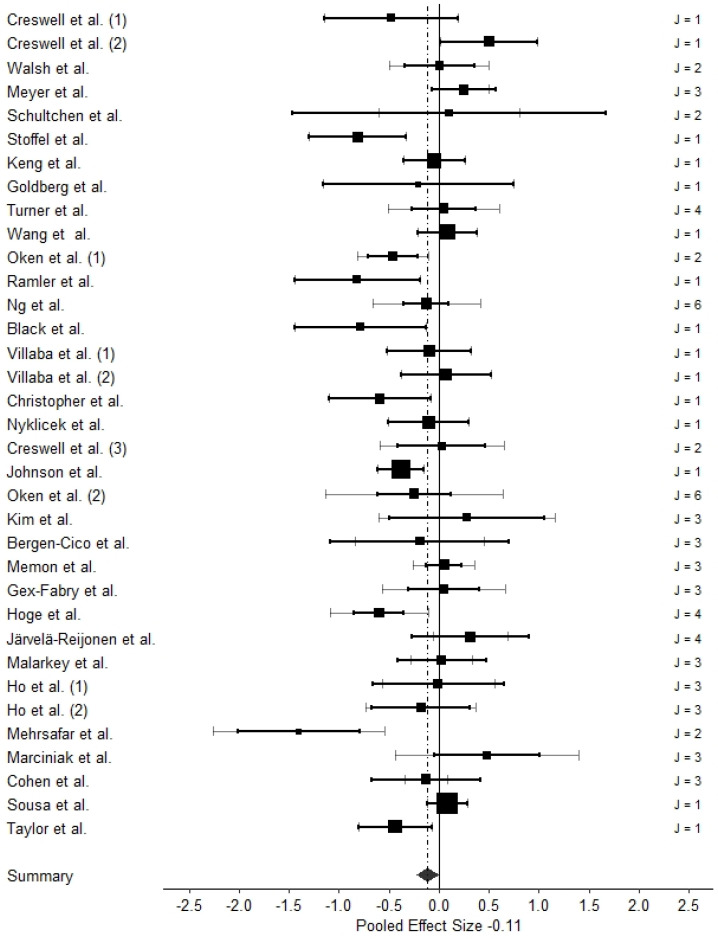
Figure 5.
Three-Level Forest Plot of TLMA 2. Note. References of included studies are provided in Table 2. Numbers in parentheses refer to different samples of the respective studies (see Table 2 for details). Aggregated effect sizes on the study level (Level 3) are represented as squares, whose size indicates the weight for the meta-analytic pooled effect estimate; black lines represent 95% confidence intervals of the aggregated effect sizes within each study (Level 3); grey lines represent 95% confidence intervals of the median precision of each individual effect size (Level 2) within each study. The black diamond represents the pooled effect estimate with its 95% confidence interval. J is the number of biomarkers within each study.

