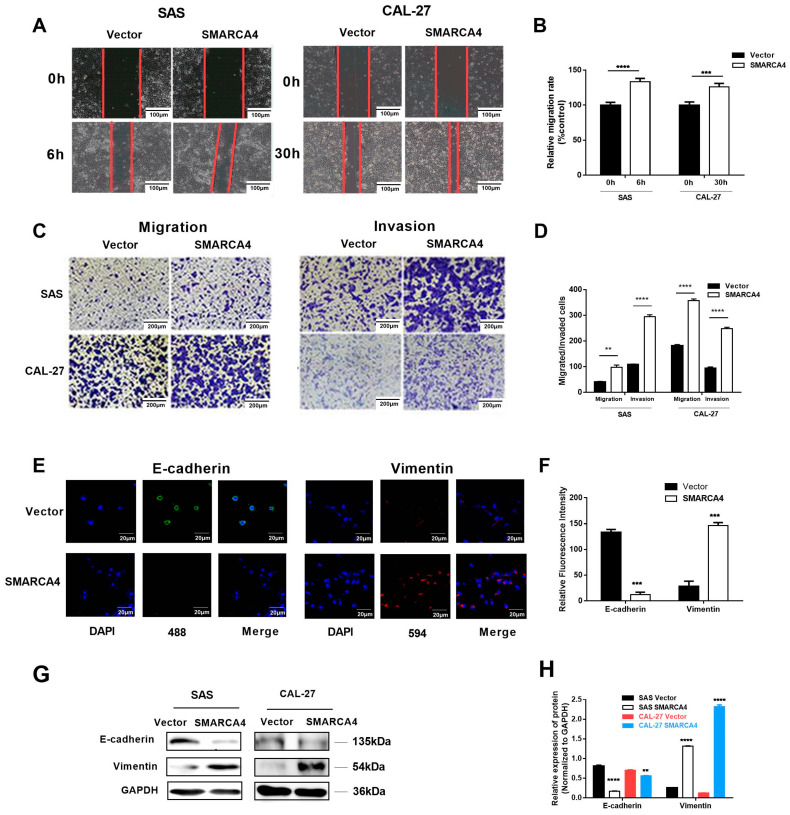
Figure 2.
SMARCA4 promotes OSCC cell migration and invasion. (A,B) The effect of SMARCA4 overexpression on OSCC cell migration. SAS or CAL-27 cells were transfected with SMARCA4 overexpression plasmid or control vector for the indicated times (6 h for SAS, 30 h for CAL-27), and cell migration was assessed by the wound healing assay. Scale bar: 100 µm (A). Quantitative analysis was performed using the Image J version 1.48 software (B). (C,D) The effect of SMARCA4 overexpression on OSCC cell migration and invasion. SAS or CAL-27 cells were transfected with SMARCA4 overexpression plasmid or control vector for the indicated times (24 h for SAS, 48 h for CAL-27). Cell migration and invasion were assessed by Transwell migration and invasion assays. Scale bar: 200 µm (C). Quantitative analysis was performed using the Image J software (D). (E,F) Representative images of E-cadherin and vimentin expression in SAS cells detected by immunofluorescence staining after SAS cells were transfected with SMARCA4 overexpression plasmid or control vector for 48 h (Scale bar: 20 µm, green represents E-cadherin, red represents vimentin, and nucleus is shown in blue by DAPI staining). (G) The effect of SMARCA4 overexpression on OSCC cell E-cadherin and vimentin protein expression levels. SAS and CAL-27 cells were transfected with SMARCA4 overexpression plasmid or control vector for 48 h, and the E-cadherin or vimentin protein expression levels were measured by Western blot analysis. (H) Quantitative analysis was performed using the Image J software. Data are expressed as the mean ± SEM from triplicate experiments. ** p < 0.01, *** p < 0.001, **** p < 0.0001 vs control vector group.

