Figure 1.
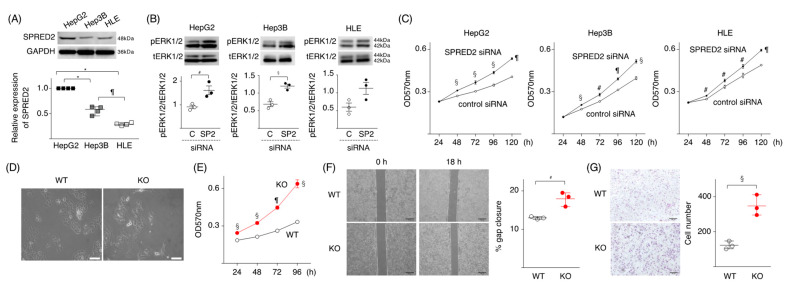
SPRED2 negatively regulates cancer cell proliferation, migration, and invasiveness. (A) The expression level of SPRED2 in HepG2, Hep3B and HLE cells was evaluated by western blotting. Band densities were digitized and semi-quantitated (n = 4, each). The level in HepG2 was regarded as 1. (B) ERK1/2 phosphorylation in HepG2, Hep3B and HLE, transfected with SPRED2-specific (SP2:●) or non-targeting control siRNA (C:○) by western blotting (n = 3, each). (C) The proliferation of each cell line was evaluated by MTT assay. (D) WT- and SPRED2-KO cells (2 × 10⁵/well) were incubated in 60 mm plastic dishes for 24 h and the cell morphology was examined under microscopy. Representative photos are shown. Scale bars: 50 μm. (E) The proliferation of WT- and SPRED2-KO cells was evaluated by MTT assay. (F) Migration/proliferation of WT- and SPRED2-KO cells by a scratch assay. Left panel, the images were captured with an inverted microscope. Representative photos are shown. Scale bars: 200 μm. Right panel, the gap distance at different time points was measured by Image J software (n = 3, each). (G) Matrigel invasion assay. Left panel, representative photos. Scale bars: 100 μm. Right panel, three low-power fields (magnification, 10×) were randomly selected from each chamber to count the migrated cells (n = 3, each). # p < 0.05, § p < 0.01, ¶ p < 0.001, * p < 0.0001, two-tailed unpaired t test (A–C,E–G).

