
Figure 2.
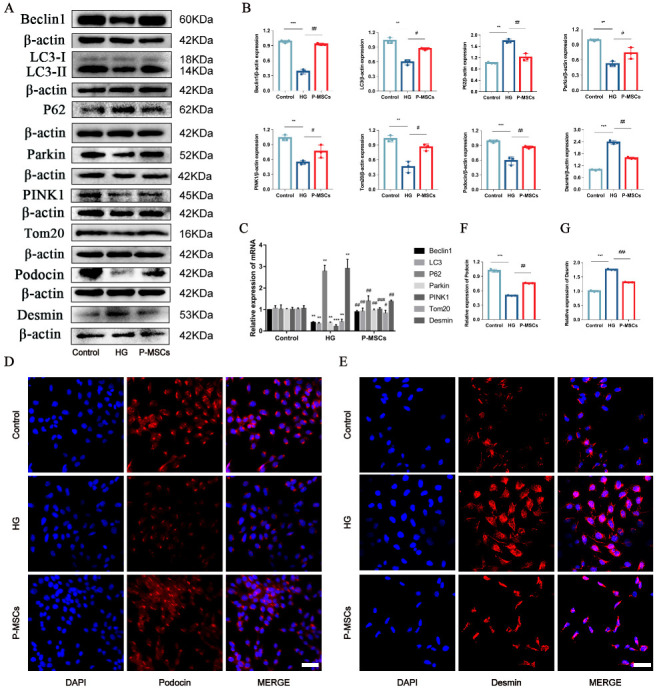
P-MSCs attenuated HG-induced podocyte injury and PINK1/Parkin-mediated mitophagy inhibition. (A,B) Representative Western blot analysis of Beclin1, LC3II/LC3I ratio, P62, Parkin, PINK1, and Tom20 as well as Podocin and Desmin in MPC5. (C) Representative RT-PCR analysis of Beclin1, LC3II/LC3I ratio, P62, Parkin, PINK1, and Tom20, as well as Desmin in MPC5. (D–G) Immunofluorescence staining of Podocin and Desmin in MPC5 (Magnification, 400×). Scale bars: 50 μm for (D,E). n = 3 for (A–E). Values are expressed as the mean ± SD. β-actin was used as loading control. ** p < 0.01 and *** p < 0.001 vs. control, # p < 0.05, ## p < 0.01, and ### p < 0.01 vs. HG.