
Figure 5.
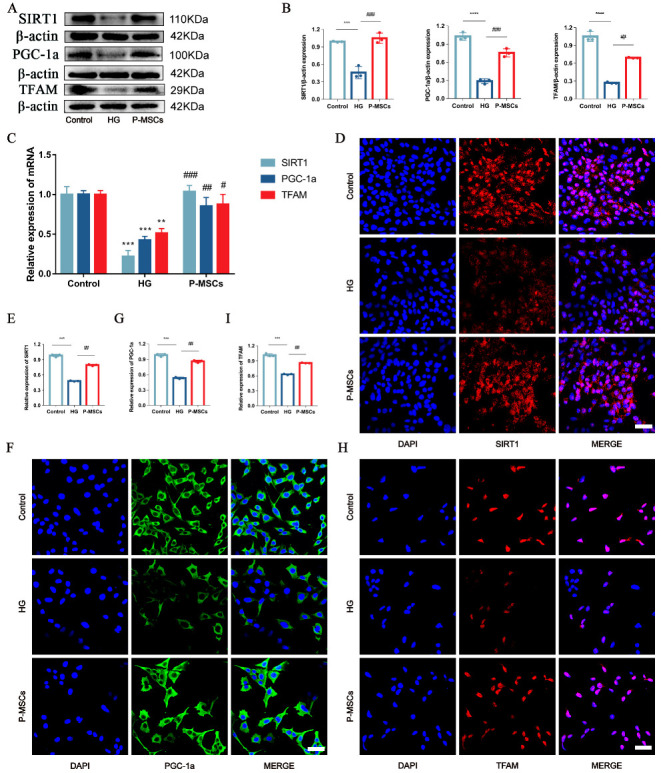
P-MSCs increased the expressions of SIRT1, PGC-1a, and TFAM in MPC5. (A,B) Representative Western blot analysis of SIRT1, PGC-1a, and TFAM in MPC5. (C) Representative RT-PCR analysis of SIRT1, PGC-1a, and TFAM in MPC5. D-I: Immunofluorescence staining of SIRT1, PGC-1a, and TFAM in MPC5 (Magnification, 400×). Scale bars: 50 μm for (D,F,H). n = 3 for (A–I). Values are expressed as the mean ± SD. Β-actin was used as loading control. ** p < 0.01, *** p < 0.001, and **** p < 0.0001 vs. control, # p < 0.05, ## p < 0.01, and ### p < 0.001 vs. HG.