
Figure 6.
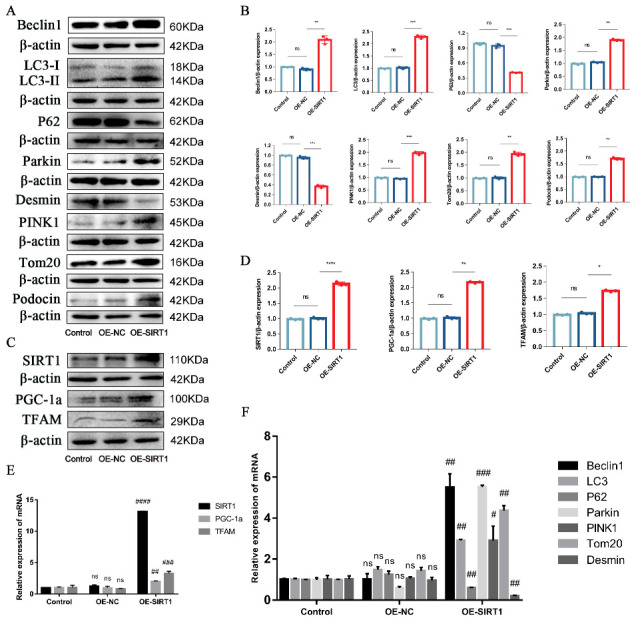
SIRT1 overexpression alleviated podocyte injury and PINK1/Parkin-mediated mitophagy inhibition. (A,B) Representative Western blot analysis of Beclin1, LC3II/LC3I ratio, P62, Parkin, PINK1, and Tom20, as well as Podocin and Desmin in MPC5. (C,D) Representative Western blot analysis of SIRT1, PGC-1a, and TFAM in MPC5. (E) Representative RT-PCR analysis of SIRT1, PGC-1a, and TFAM in MPC5. (F) Representative RT-PCR analysis of Beclin1, LC3II/LC3I ratio, P62, Parkin, PINK1, and Tom20, as well as Desmin in MPC5. n = 3 for (A–F). β-actin was used as loading control. * p < 0.05, ** p < 0.01, *** p < 0.001 and **** p < 0.0001 vs. the negative control vector (OE-NC). # p < 0.05, ## p < 0.01, ### p < 0.001, and #### p < 0.0001 vs. OE-NC; ns = not significant.