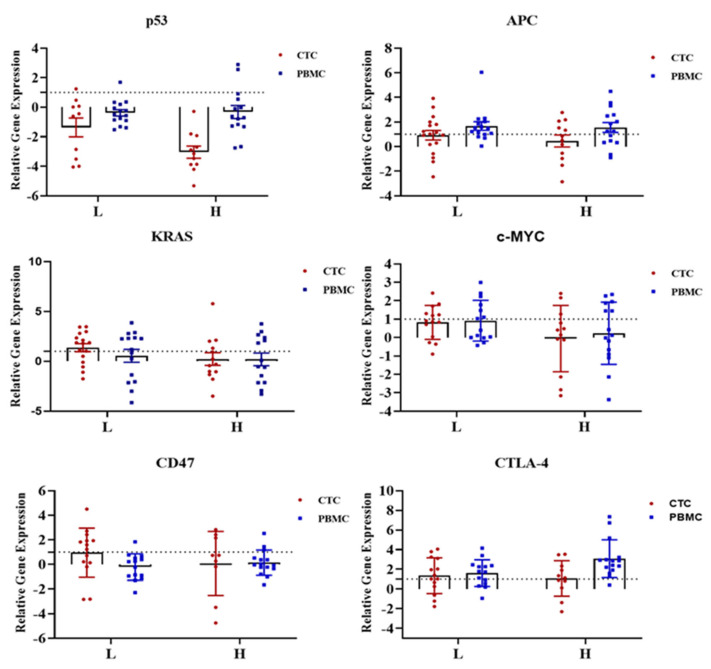
Figure 3.
Comparison of the gene expression of oncogenes (KRAS, c-Myc), tumour suppressor genes (p53, APC) and immune checkpoint molecules (CTLA-4, CD47) between high versus low CTC-positive groups in CTCs and PBMCs from patients with colorectal carcinoma (CRC). Data are depicted as scatter plots interleaved with bar plots, indicating min. to max. value. All the values are plotted as mean ± SEM. The dashed line indicates the normal fold change value. The PCR data were shown on a log2 scale and analysed by unpaired two-way ANOVA (Bonferroni’s multiple comparison test). Comparisons were considered significant at p ≤ 0.05.

