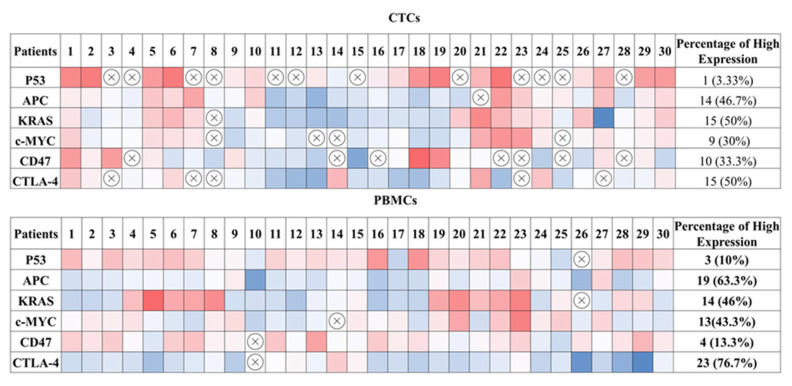
Figure 6.
Heat map depicting the mRNA expression level and percentage of positive expression of the tumour suppressor genes p53 and APC; the oncogenes, KRAS and c-Myc; and the immune-regulatory molecules CD47 and CTLA-4 in CTCs and PBMCs among individual patients. The values were calculated from the log2 value of the relative quantification of each gene. The colour indicates the expression level for each gene. Red fields represent downregulated genes; blue fields represent upregulated genes; crossed-out fields represent no expression.

