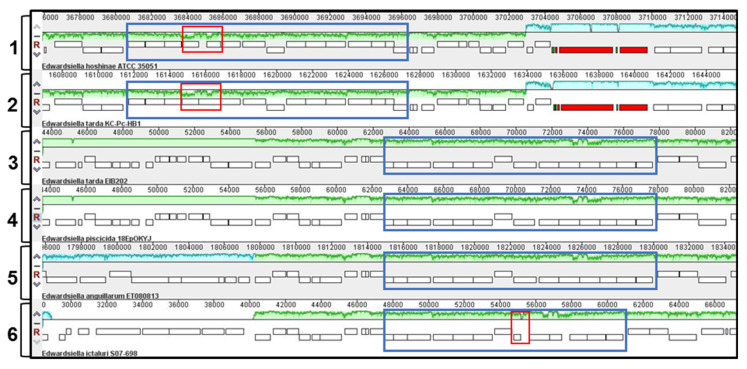
Figure 1.
Comparative genomic analysis using progressive Mauve to identify the waa cluster on the chromosomes of E. hoshinae ATCC35051 (track 1), E. tarda KC-Pc-HB1 (track 2), E. tarda EIB202 (track 3), E. piscicida 18EpOKYJ (track 4), E. anguillarum ET080813 (track 5) and E. ictaluri S07-698 (track 6). Matching colors indicate homologous segments that are connected across genomes. Chromosomal regions inside blue squares contain waa clusters, and red squares show differences in comparison to E. tarda EIB202.

