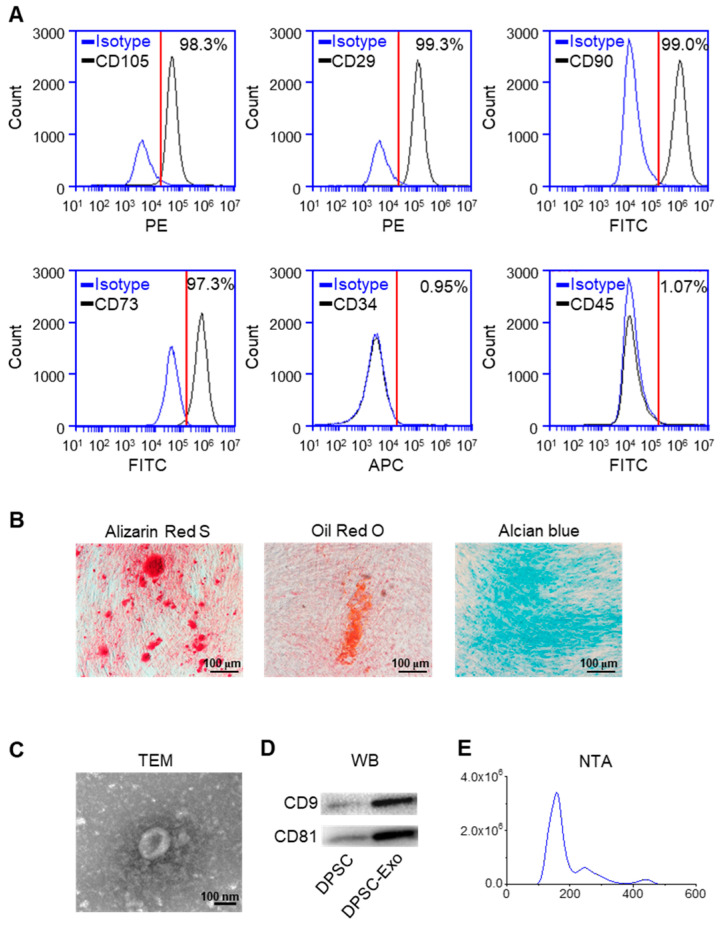
Figure 1.
Identification of human DPSCs and exosomes. (A) The flow cytometry analysis showed that the DPSCs highly expressed CD105, CD29, CD90, and CD73, while CD34 and CD45 were almost not expressed in the DPSCs. Red line: the threshold of positive cells. (B) Alizarin Red S, Oil Red O, and Alcian Blue staining showed that the DPSCs had the capacity for multi-lineage differentiation after osteogenic, adipogenic, and chondrogenic induction, respectively. (C) Transmission electron microscope image of DPSC-Exos. (D) The Western blot results showed high expression of exosome-specific markers CD9 and CD81 in the DPSC-Exos compared with the DPSCs. (E) The particle size distribution of DPSC-Exos was analyzed by NanoSight.

