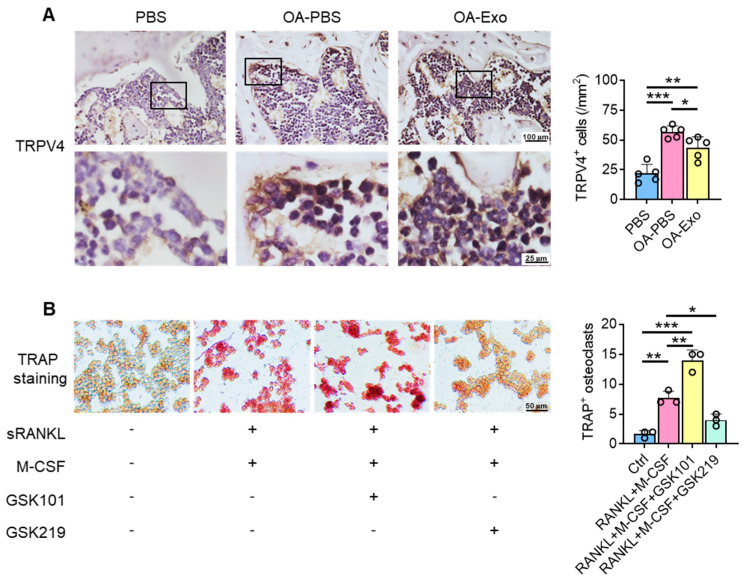
Figure 5.
DPSC-Exos regulated osteoclast activation via TRPV4. (A) Representative images of TRPV4 in the subchondral bone by IHC staining. Data are presented by mean ± SD. * p < 0.05, ** p < 0.01, *** p < 0.001; n = 5. (B) Representative images of RAW 264.7 cells by TRAP staining after TRPV4 activation/inhibition. The data were collected from three independent samples and are presented by mean ± SD. * p < 0.05, ** p < 0.01, *** p < 0.001.

