Figure 5.
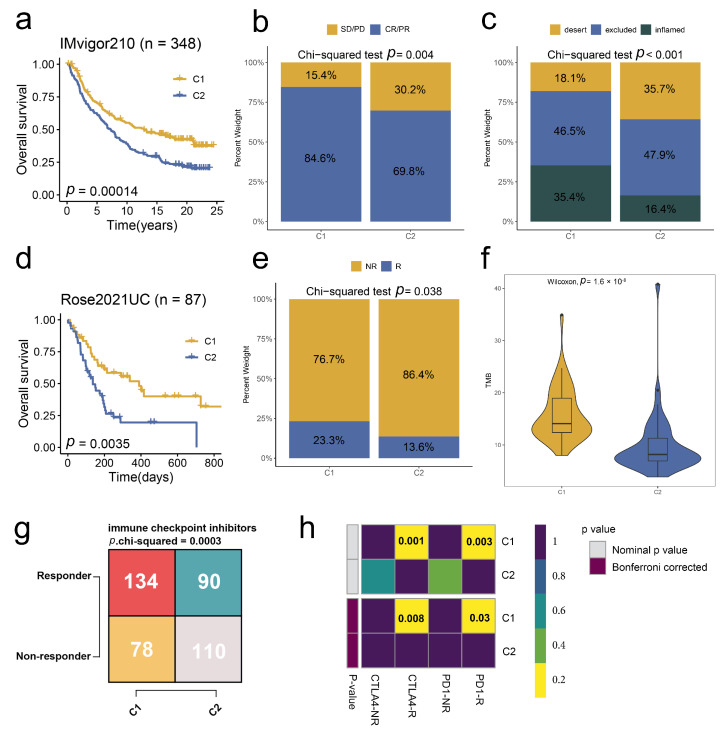
Stem. Sig. predicts immunotherapeutic responses in ICIs-treated BCa cohorts. (a) KM curves with log-rank test revealed the good prognosis of cluster 1. (b) The proportions of SD/PD and CR/PR between the two clusters. (c) The proportions of the immune phenotypes between two clusters. (a–c) Data were analyzed in the IMvigor210 dataset. (d) KM curves with log-rank test revealed the good prognosis of cluster 1. (e) The proportions of R and NR between the two clusters. (f) The distribution of TMB between two clusters. (g) A contingency table of the numbers of responders and non-responders to ICIs therapy between two clusters. Data were analyzed by the TIDE algorithm. (h) A contingency table between responses to ICIs therapy (anti-PD-1 and anti-CTLA-4) and two clusters based on the SubMap module of the GenePattern online framework.

