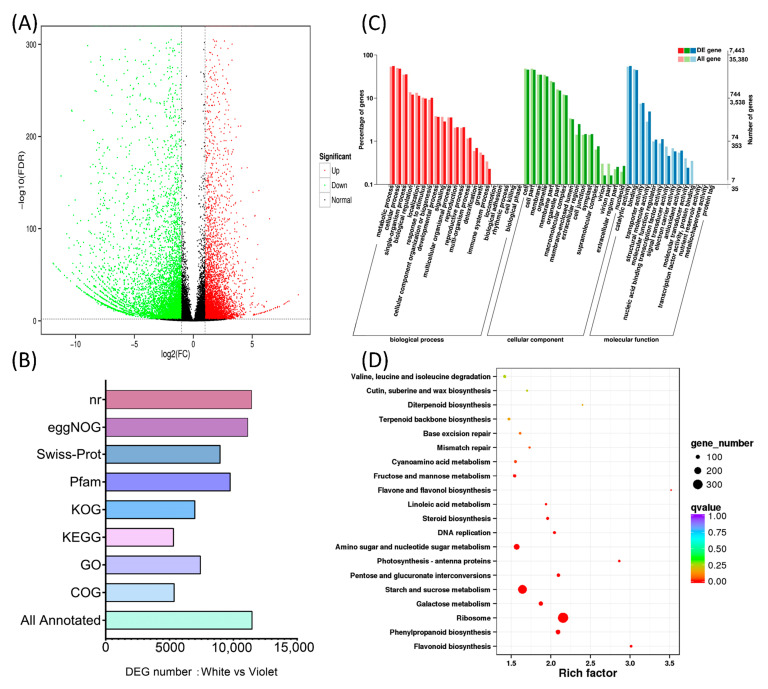
Figure 5.
Differential transcriptomics analysis of white and violet flowers. (A) Volcano diagram of the transcript differential expression between white and violet flowers. (B) Multi-database annotation of differentially expressed transcripts between white and violet flowers. (C) GO annotation of differentially expressed transcripts between white flowers and violet flowers. (D) KEGG pathway enrichment annotation of differentially expressed transcripts between white and violet flowers.

