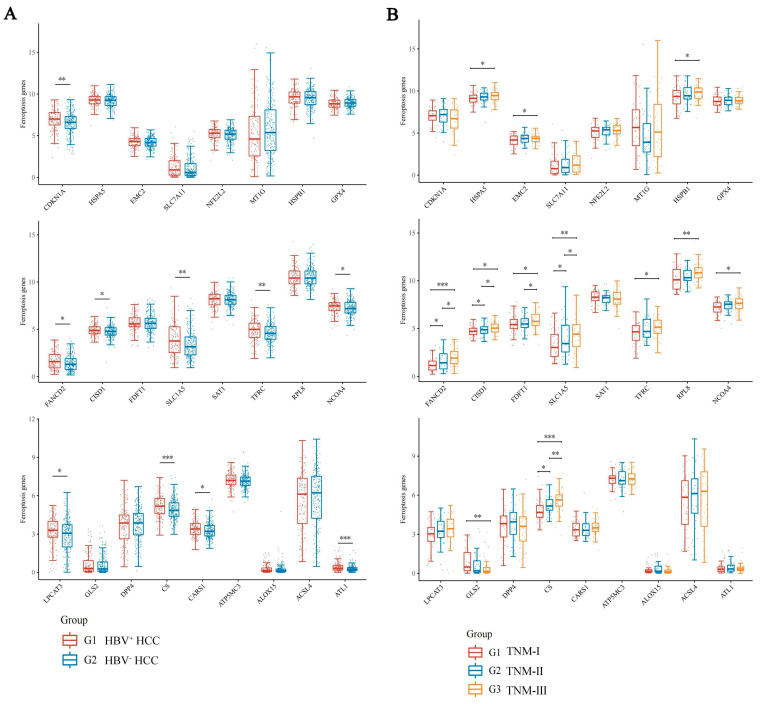
Figure 1.
Expression distribution of ferroptosis-related gene mRNA in HCC tissues. The x-axis represents different ferroptosis related genes, and the y-axis represents gene expression distribution. Different colors represent different groups. (A) Expression distribution of ferroptosis related gene mRNA in HBV-positive HCC (red) and the HBV-negative HCC (blue). (B) The expression distribution of ferroptosis-related gene mRNA in HBV-related HCC with TNM I (red), II (blue) and III (yellow). * p < 0.05, ** p < 0.01, *** p < 0.001. The statistical difference between two groups was compared through the Wilcox test, significance difference of three groups was tested with Kruskal–Wallis test.

