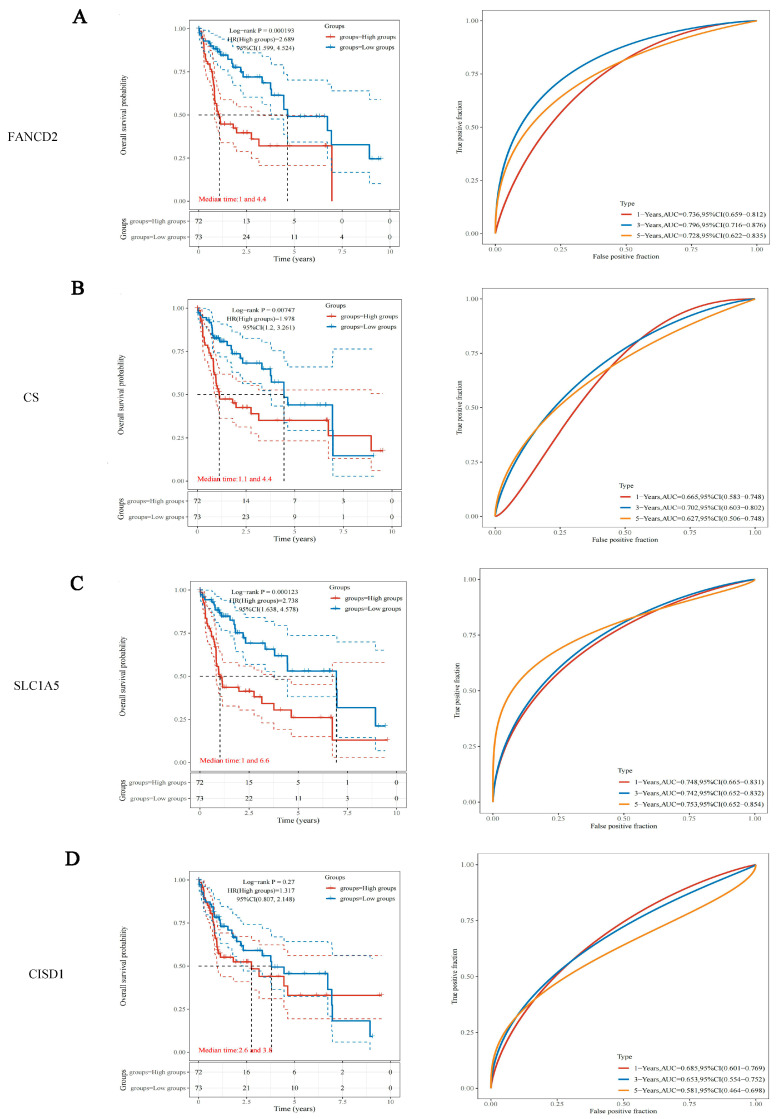
Figure 2.
Overall survival analysis of FANCD2, CS, SLC1A5 and CISD1 in HBV-related HCC. (left) Kaplan–Meier survival analysis of FANCD2 (A), CS (B), SLC1A5 (C) and CISD1 (D) signature from the TCGA dataset, comparison among different groups was made by log-rank test. HR (High exp) represents the hazard ratio of the low-expression sample relatives to the high-expression sample. HR > 1 indicates the gene is a risk factor, and HR < 1 indicates the gene is a protective factor. HR(95%Cl), the median survival time (LT50) for different groups. (right) The ROC curve of the genes. Higher values of AUC correspond to higher predictive power.

