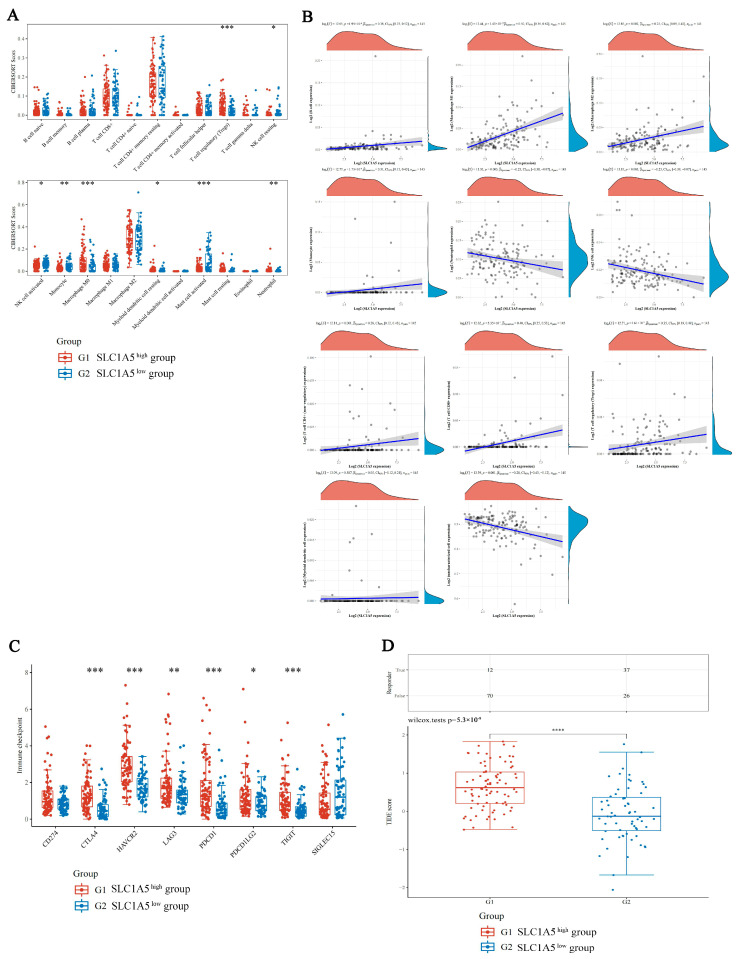
Figure 4.
Comparison of immune characteristics and potential ICB response in different expression level groups of SLC1A5 in HBV-related HCC. (A) The expression distribution of CIBERSORT immune score in high-SLC1A5 (red) and low-SLC1A5 (blue) groups. The x-axis represents immune cell types, and the y-axis represents the expression distribution of immune score in different groups. (B) The correlations between SLC1A5 expression and immune score were analyzed with Spearman. The x-axis represents the distribution of the SLC1A5 expression or the score, and the y-axis represents the distribution of the immune score. The density curve on the right represents the trend in the distribution of the immune score, and the upper density curve represents the trend in the distribution of the gene expression or the score. The value above represents the correlation p value, correlation coefficient and correlation calculation method. (C) The expression distribution of immune checkpoints gene in high-SLC1A5 (red) and low-SLC1A5 (blue) groups. The x-axis represents different groups of samples, and the y-axis represents the expression distribution of gene. (D) Statistical table of immune response of samples and the distribution of immune response scores in high-SLC1A5 (red) and low-SLC1A5 (blue) groups. * p < 0.05, ** p < 0.01, *** p < 0.001, **** p < 0.0001.

