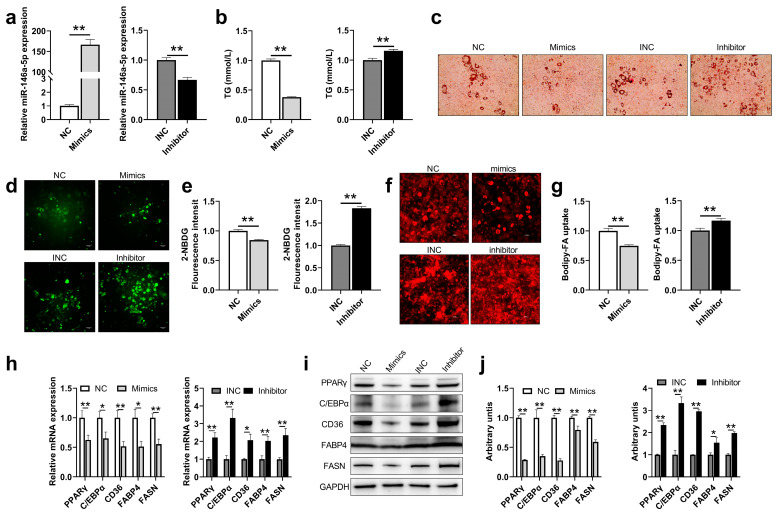
Figure 3.
miR-146a-5p was associated with adipogenesis and glucose uptake and fatty acid absorption. (a) miR-146a-5p gene expressions in 3T3-L1 adipose mature cells after transfections of miR-146a-5p mimics (Mimics) and miR-146a-5p inhibitor (Inhibitor) (n = 6). (b) TG content in 3T3-L1 adipose mature cells after transfections of mimics and inhibitor (n = 6). (c) Oil red O staining photographs in 3T3-L1 adipose mature cells after transfections of mimics and inhibitor (scale bar = 50 μm). (d) Fluorescence image of 3T3-L1 cells treated with glucose analog 2-NBDG for 1 h after transfections of mimics and inhibitor for 24 h (bar = 50 μm). (e) Statistical graph of fluorescence value of 3T3-L1 cells treated with glucose analog 2-NBDG (n = 4). (f) Fluorescence image of 3T3-L1 cells treated with free fatty acid analog Bodipy-FA for 4 h after transfections of mimics and inhibitor for 24 h (bar = 50 μm). (g) Statistical graph of fluorescence value of 3T3-L1 cells treated with free fatty acid analog Bodipy-FA (n = 4). (h) After transfection of mimics and inhibitor adipogenesis-related genes PPARγ, C/EBPα, and fatty acid synthesis-related genes CD36, FABP4, and FASN were detected by real-time quantitative PCR in mature 3T3-L1 (n = 6). (i,j) After transfection of mimics and inhibitor, adipogenesis-related proteins PPARγ, C/EBPα, and fatty acid synthesis-related proteins CD36, FABP4, and FASN were detected by Western Blot (n = 6). Values are presented as means ± SEM, * p < 0.05, and ** p < 0.01, according to the non-paired Student’s t-test or one-way ANOVA between individual groups.

