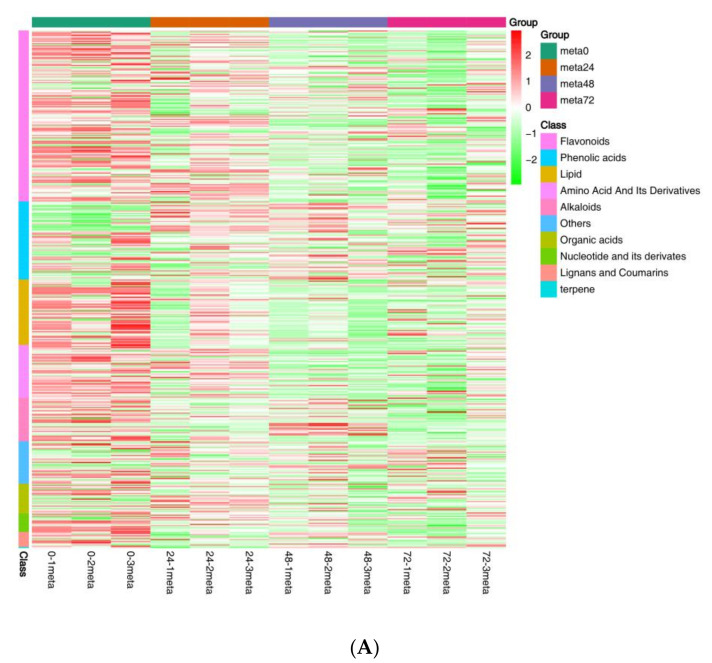
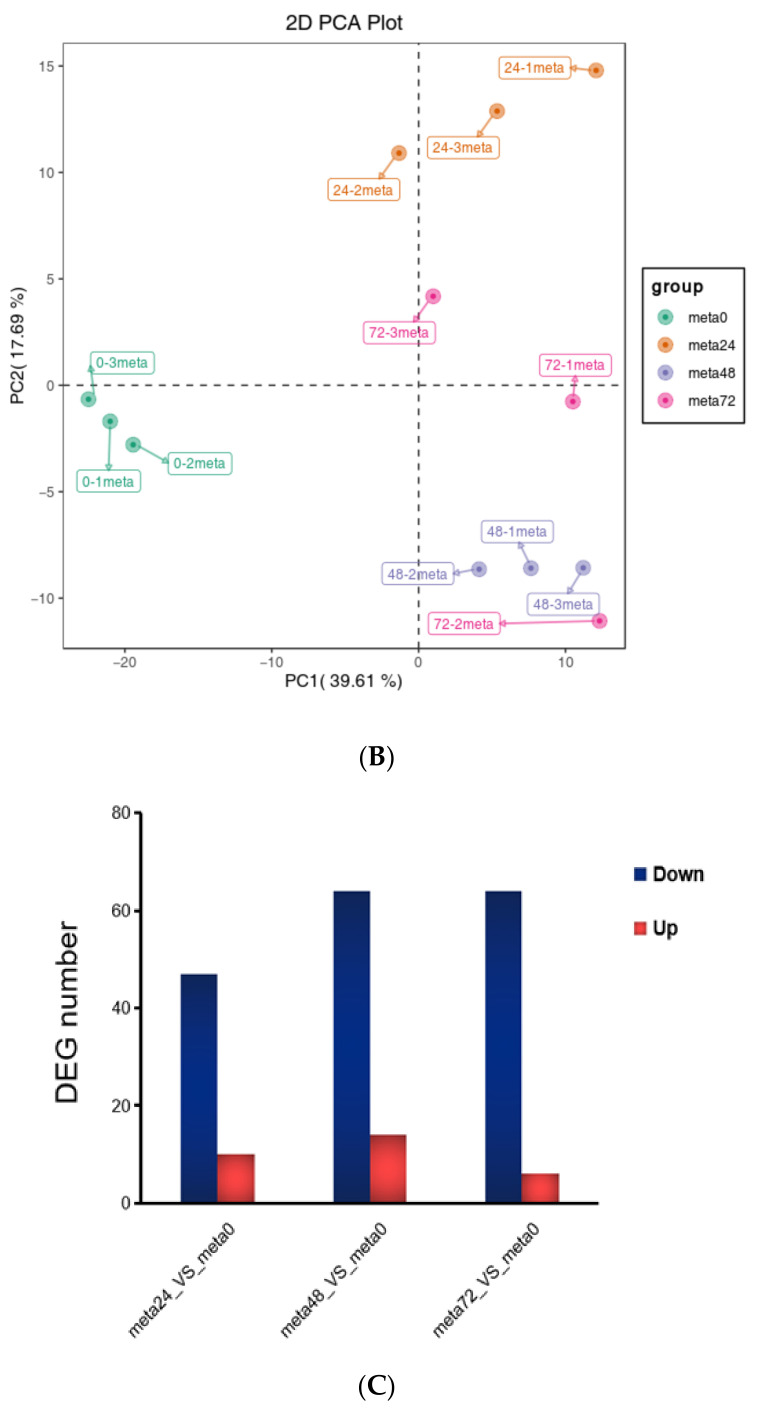
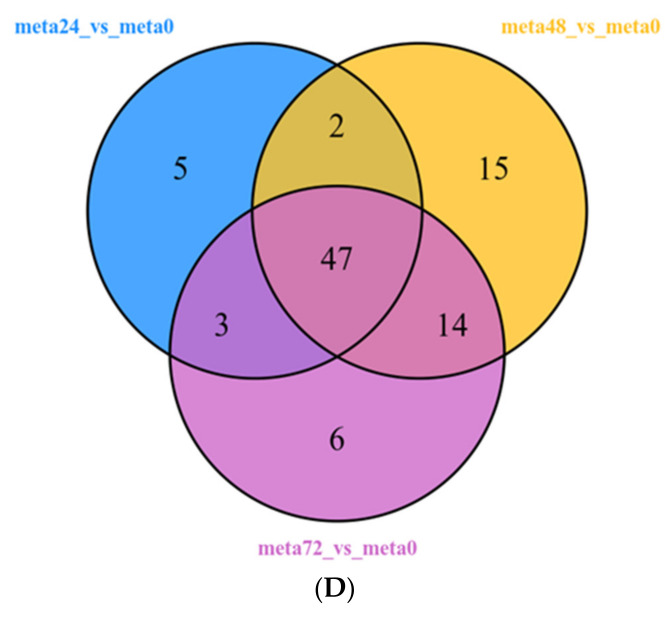
Figure 4.
Overall analysis of the metabolomic changes in rice in response to SBPH nymph infestation. (A) Hierarchical cluster analysis of differentially accumulated metabolites (DAMs) between the three groups of SBPH nymphs-infested time-points (meta24, meta48, or meta72) and control (meta0) groups; each group contained three biological replicates. (B) Principal component analysis of each metabolite sample; the X-axis and Y-axis represent the first and second principal components, respectively. (C) A histogram with DAMs in plants infested by SBPH nymphs (24 h time-point, 48 h time-point, or 72 h time-point) compared to the control group (0 h time-point). Down, down-regulated DEGs; Up, up-regulated DEGs. (D) Venn of DAMs in each comparison group.


