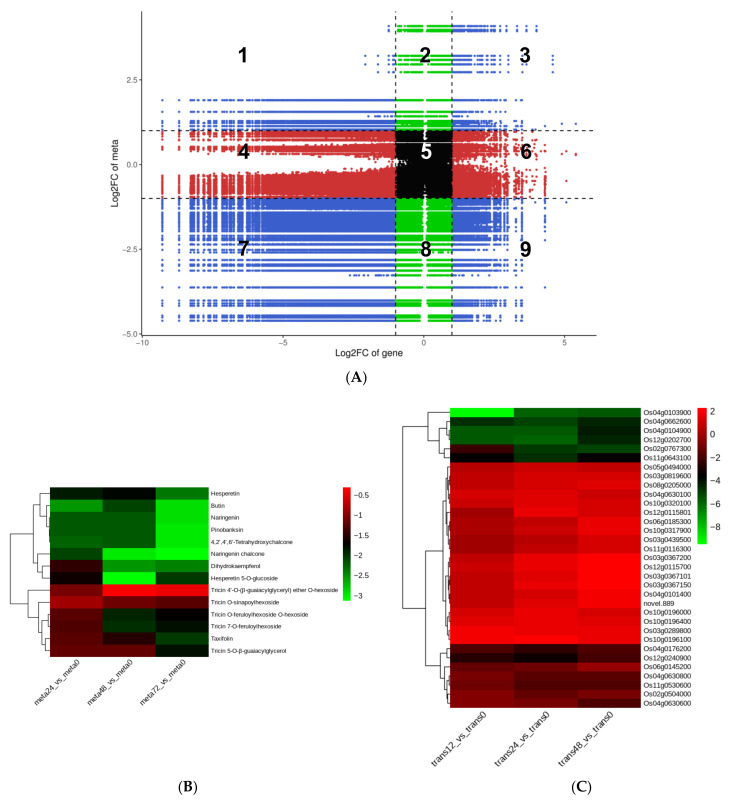
Figure 6.
Correlation analysis revealing the potential regulatory network between DEGs and DAMs. (A) A nine-quadrant diagram showing the association of differentially expressed genes (DEGs) with differentially accumulated metabolites (DAMs) in the meta48-trans24 vs. meta0-trans0 comparison group. A Pearson correlation coefficient (PCC) of > 0.80 and p ≤ 0.05 were selected as the criteria and visualized using a nine-quadrant graph. The X-axis and Y-axis represent the log2FC of genes and metabolites, respectively. From left to right, from top to bottom, the nine-quadrant diagram was divided into 1–9 quadrants using a black dotted line. Quadrants 1–9 depict that the differential expression patterns of genes and metabolites are opposite; quadrant 5 shows that neither genes nor metabolites are differentially expressed; quadrants 2, 4, 6, and 8 indicate that metabolite expression is unchanged while genes are up or downregulated, or gene expression is unchanged while metabolites are up or downregulated; quadrants 3 and 7 show that the differential expression patterns of genes and metabolites are consistent. Heatmaps of DAMs (B) and DEGs (C) involved in the flavonoid biosynthesis pathway in the meta48-trans24 vs. meta0-trans0 comparison group. The bar at right represents the color code for Log2-transformed data on metabolite accumulation; red indicates higher expression, and blue indicates lower expression, p ≤ 0.05.

