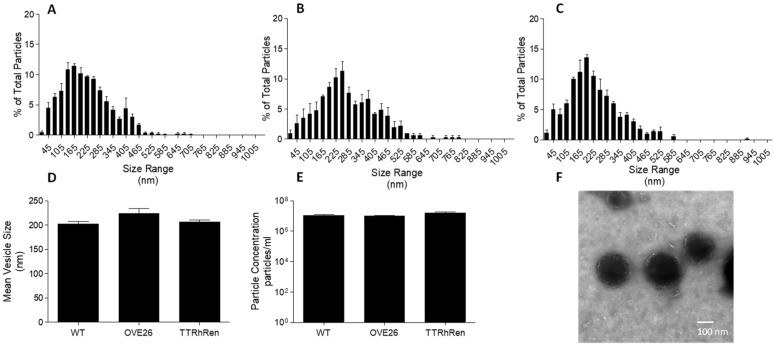
Figure 1.
Nanoparticle tracking analysis and transmission electron microscopy of large EV isolates. Shown are size distributions of L-EVs from WT (A), OVE26 (B), and TTRhRen (C) mouse plasma. (D) Comparison of mean particle size by NTA (P = NS, n = 3). (E) Comparison of particle concentration by NTA (P = NS, n = 3). (F) Representative transmission electron micrograph of pooled plasma showing distinct vesicle size and shape.

