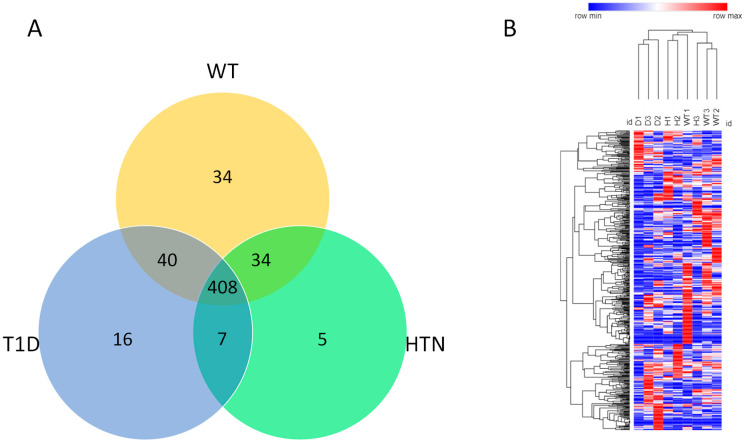
Figure 2.
Venn diagram represents the differences in protein composition among diabetes, hypertension, and wild-type mice (A). Protein profile analysis of differentially expressed proteins (Hierarchical clustering) across all three groups of mice using Morpheus (https://software.boardinstitute.org/morpheus/, (accessed on 1 June 2022)) (B).

