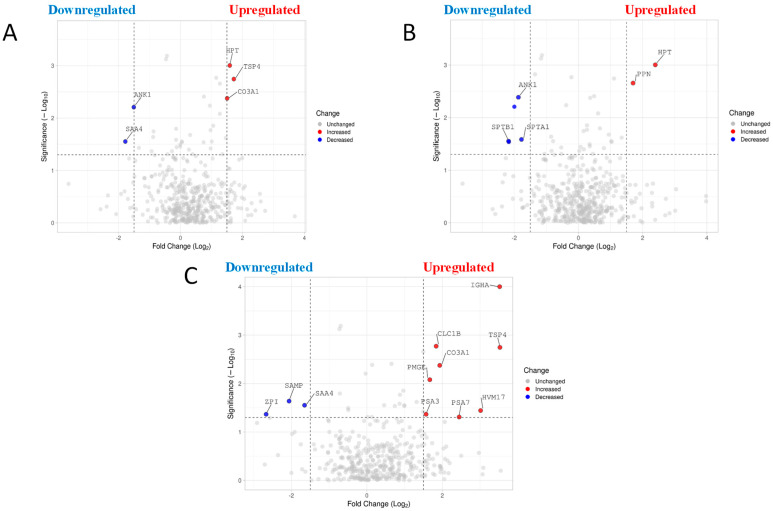
Figure 3.
Volcano plot representing differentially expressed protein comparisons. (A) Differentially expressed protein in diabetes plasma L-EVs compared to wild-type plasma L-EVs. The horizontal axis represents the log2 of fold change and the vertical axis represent p-value. Each gray dot represents a protein with red dots on the right above the dashed line are proteins upregulated while the blue dots on the left are downregulated. (−log p value of 1.3010299957 is considered significant as it translates to a p value of 0.05). VolcaNoseR. https://goedhart.shinyapps.io/VolcaNoseR/, (accessed on 15 April 2022). (B) Volcano plot representing differentially expressed protein in hypertensive plasma L-EVs compared to wild-type L-EVs. (C) Volcano plot representing differentially expressed protein in diabetes plasma L-EVs compared to hypertensive plasma L-EVs.

