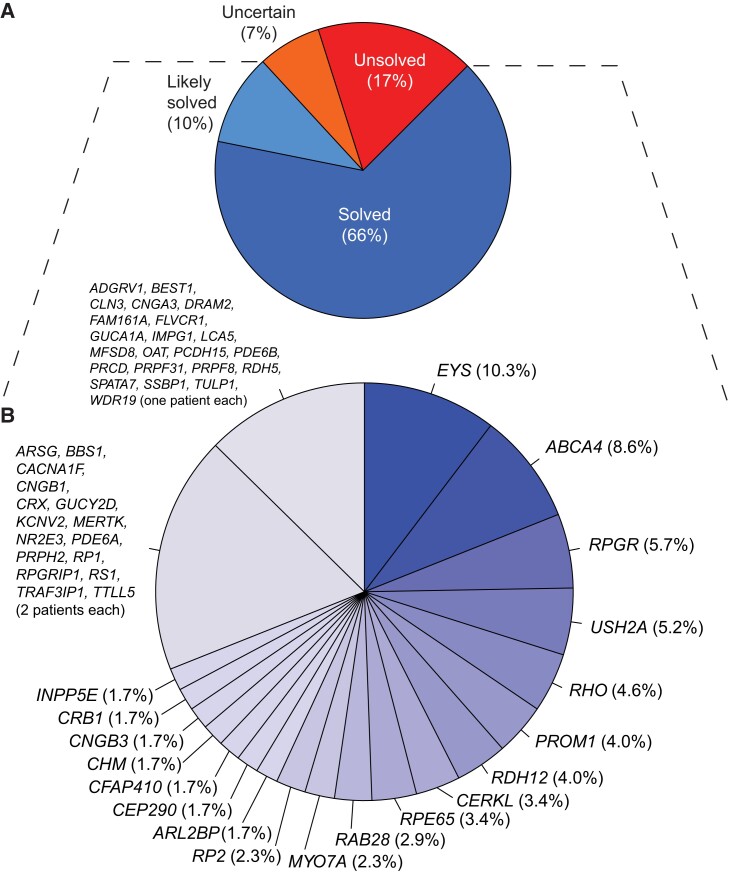
Fig. 1.
Genetic classification of the cases analyzed. A) Classification of patients by their diagnostic status at the molecular level. Percentages are computed over the total number of patients in the study. B) Further stratification of patients from the “likely solved” and “solved” classes, by disease gene harboring causative mutations, represented by individual slices of the chart. Genes that were mutated in one or two patients were grouped. Percentages are computed over the total number of patients from the “likely solved” and “solved” classes.

