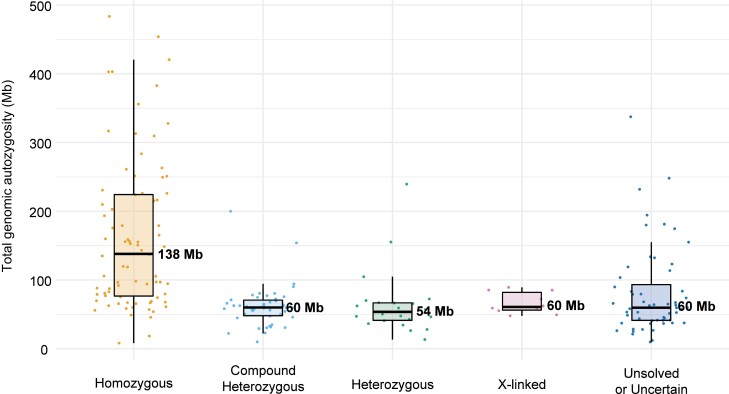
Fig. 3.
Boxplots of total genomic autozygosity, as a function of the genotypes identified. Levels of autozygosity are expressed as the sum of all homozygous regions detected in each genome, for patients analyzed by NGS procedures. Values relative to individual patients are represented by dots, while median values are indicated by horizontal thick bars, with numbers (Mb: megabases). Standard notation for boxplots applies to other components of the graph. Sixteen index subjects were not analyzed, due to lack of appropriate quality data.

