Figure 4.
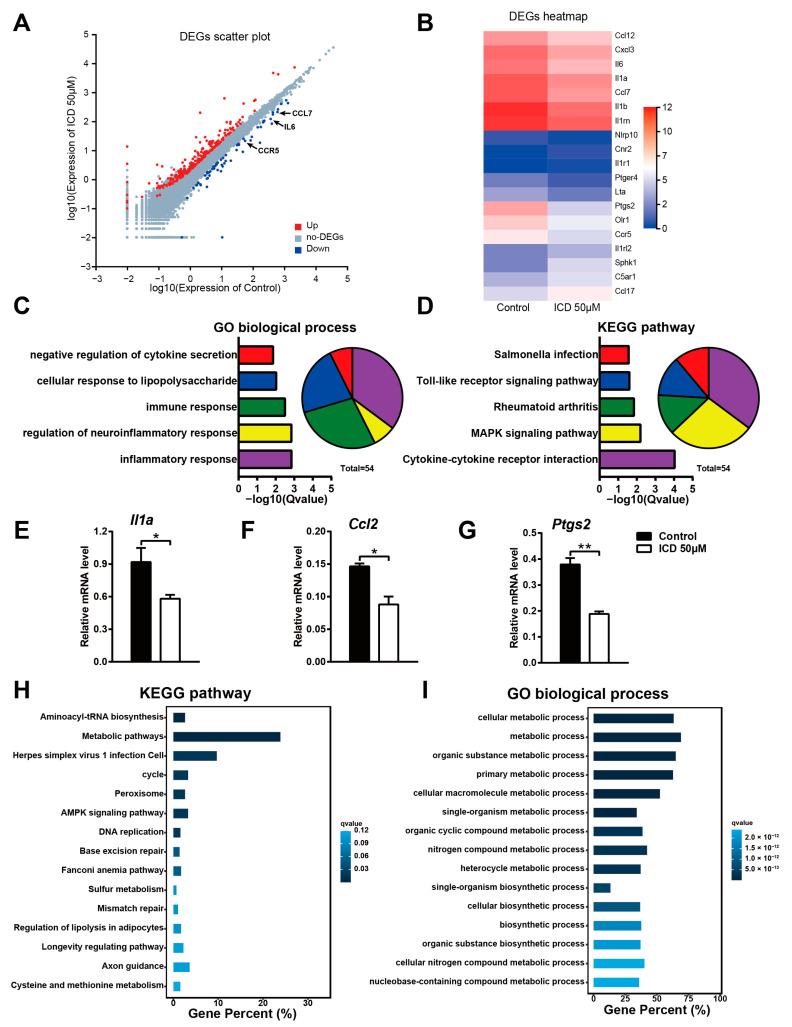
ICD compromises expression of inflammation pathway-related genes in LPS-activated macrophages. (A) Scatter plot showing gene expression changes in LPS triggered BMDMs pretreated ICD, compared to BMDMs treated with LPS alone. Downregulated genes are indicated in blue, while upregulated genes are indicated in red. (B) Heatmap of differential expressed genes involved in Inflammatory Response. The expression level is shown in the form of Log2(FPKM). (C) GO (Biological Process) analysis of the downregulated genes in ICD pretreated BMDMs. (D) KEGG analysis of the downregulated genes in ICD pretreated BMDMs. (E–G) The mRNA level of Il1a, Ccl2 and Ptgs2 in LPS stimulated macrophages for 6 h, pretreated with ICD or not. (H) KEGG analysis of the upregulated genes in ICD pretreated BMDMs. (I) GO (Biological Process) analysis of the upregulated genes in ICD pretreated BMDMs. The mean and SD of at least three independent experiments are shown. * p < 0.05, ** p < 0.01 indicate significant differences between groups as determined by a two-tailed paired Student’s t-test.

