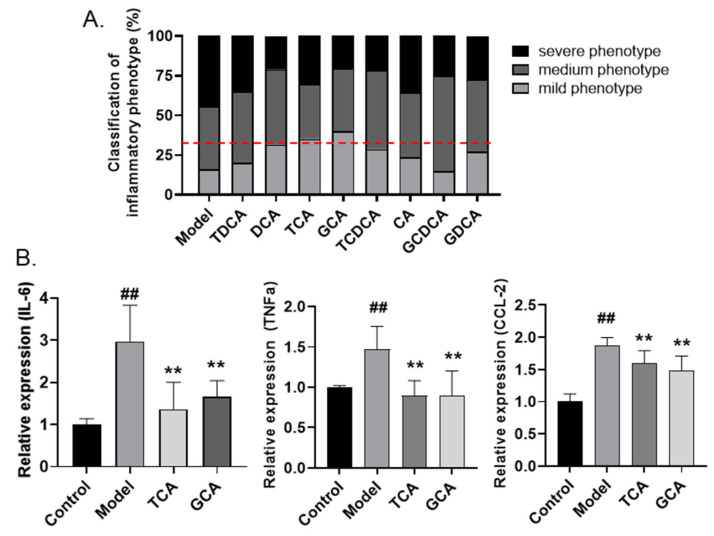
Figure 4.
Screening active compounds of bile acids in zebrafish model. (A) The classification of inflammatory phenotypes in zebrafish embryos treated with different bile acids (n > 10). The cutoff line for positive hits is shown in red dotted line. (B) The mRNA levels of IL-6, TNF-α, and CCL-2 in zebrafish embryos of different groups (n > 10). Data are presented as the mean ± SEM of three independent experiments. # Compared with the control group; * compared with the model group; ## or **, p < 0.01.

