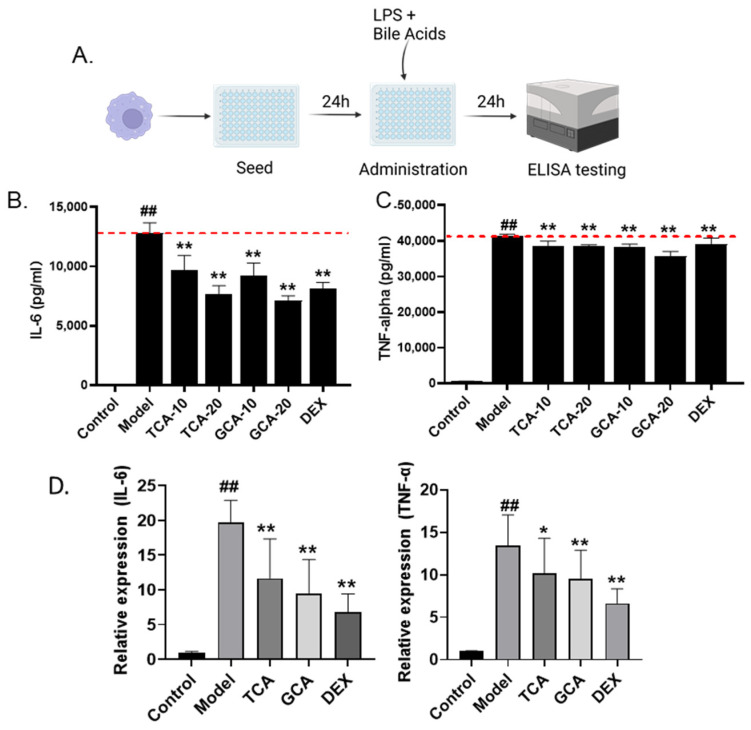
Figure 5.
Validation of TCA and GCA in LPS-stimulated macrophages. (A) Flow chart of LPS-induced macrophage cell modeling. (B,C) The effect of TCA and GCA on the secretion of IL-6 and TNF-α in LPS-stimulated RAW264.7 cells. Each bile acid was tested at two concentrations of 10 and 20 µg/mL. DEX (8 µg/mL) is used as positive control. (D) Expression of inflammatory cytokines in TCA and GCA treated macrophages. All the data are presented as the mean ± SEM of three independent experiments. # Compared with the control group; *compared with the model group; *, p < 0.05, ## or **, p < 0.01.

