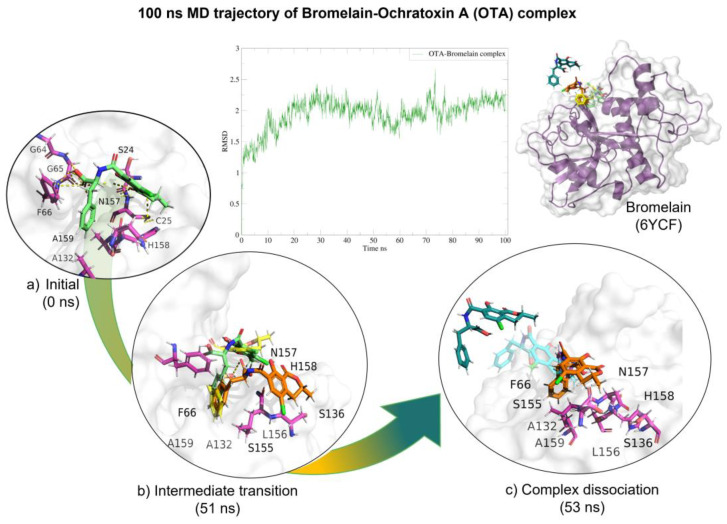
Figure 6.
Molecular dynamics of the bromelain-OTA complex. The root mean squared deviation (RMSD) plot shows changes in the complex conformation with respect to the initial state during 100 (ns). (a) Initial pose (0 ns), complex initial state obtained from molecular docking studies. (b) Intermediate transition poses visualization where OTA moves within the ligand binding site. (c) Complex dissociation, OTA unbound from bromelain binding site. Green, OTA’s initial pose; Yellow, OTA at 31 (ns); Orange, OTA at 51 (ns); Blue, OTA at 52 (ns), Dark green, OTA at 53 (ns).

