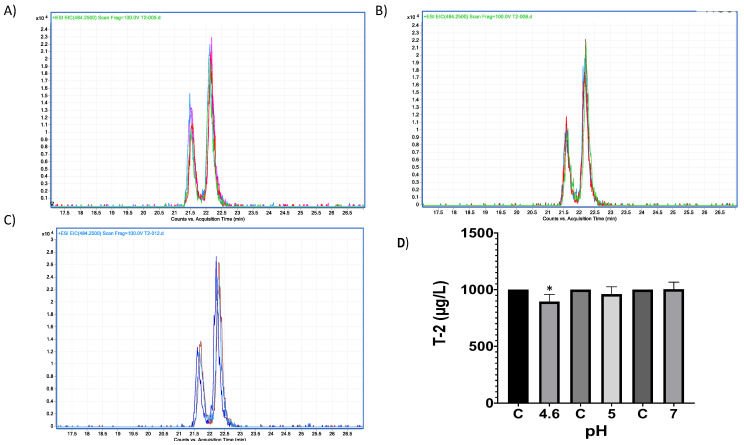
Figure 12.
HPLC–TOF–MS chromatograms of trypsin-T2 in vitro experiments at different pH conditions and incubated a 41 °C. (A) pH 4.6; (B). pH 5; (C) pH 7. (D) Bars show T-2 (µg/L) degradation (10.68%) by trypsin at pH 4.6. Chromatograms include the control peak (red) and the experimental assay with two repetitions (pink, blue and green). The double peak belongs to T-2 (22.12 m/z). (* p < 0.05).

