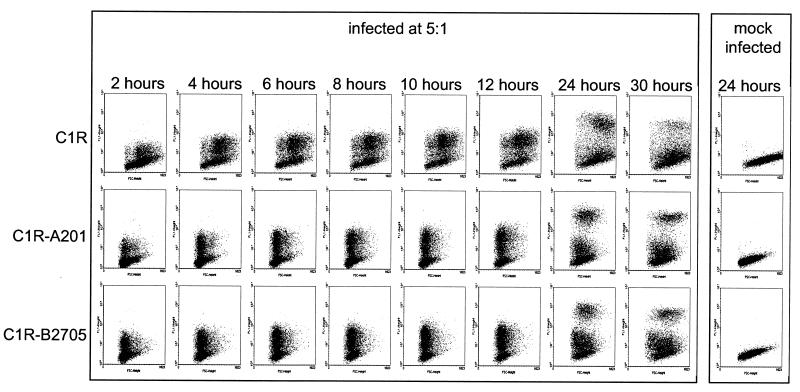
FIG. 4.
Time course of C. trachomatis infection in C1R, C1R-A201, and C1R-B2705 cell lines. Dot plots of forward scatter against fluorescence are shown for the indicated cell lines, stained with anti-EB–FITC at the indicated times after addition of C. trachomatis at a multiplicity of 5:1. Examples of the negative staining obtained with mock-infected cells are also shown. Similar results to those shown were observed in a repeat experiment (not shown).

