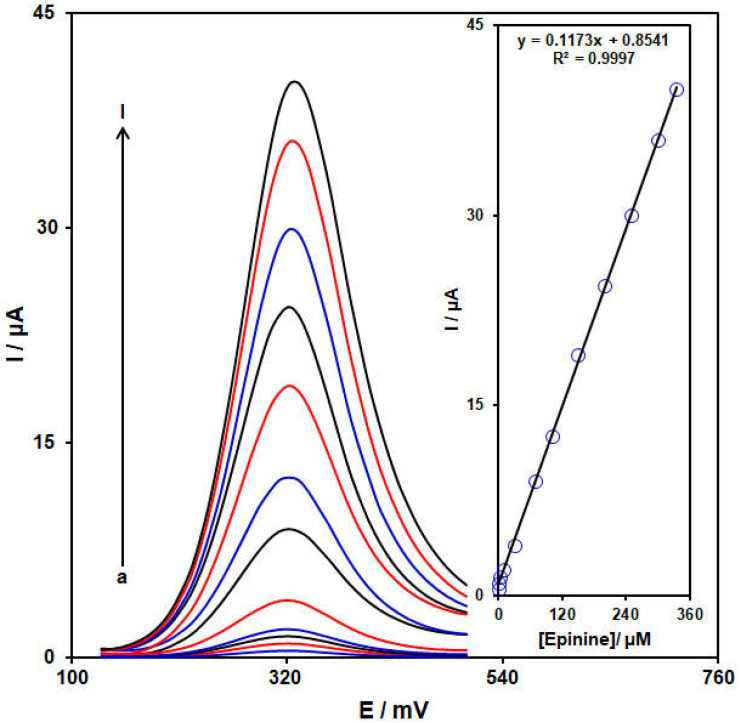
Figure 9.
Differential pulse voltammograms captured for the NiCo-MOF/SPGE in the exposure to variable epinine concentrations, a–l correspond to (a) 0.07, (b) 0.5, (c) 2.5, (d) 10.0, (e) 30.0, (f) 70.0, (g) 100.0, (h) 150.0, (i) 200.0, (j) 250.0, (k) 300.0, and (l) 335.0 μM epinine in PBS (pH 7.0, 0.1 M). Insets: Relationships between the Ipa and levels of epinine.

