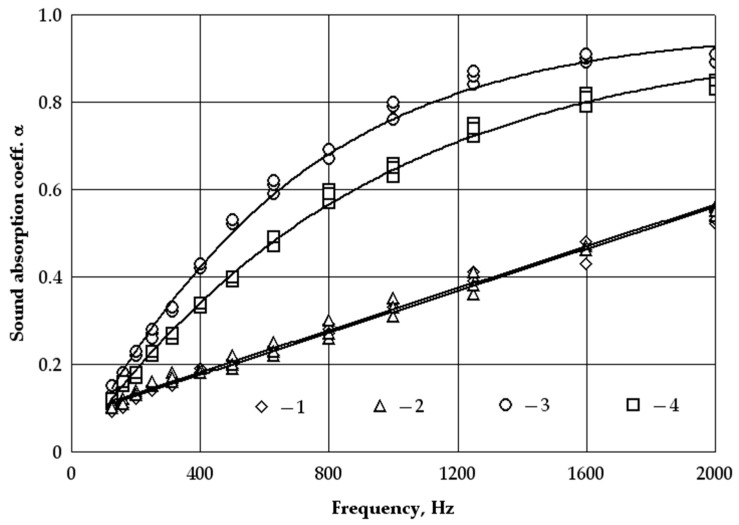
Figure 4.
Graphical interpretation of the regression line (Equations (4)–(7)) for the dependence of the sound absorption coefficient on the frequency of the waste product from woollen yarn at different densities (kg/m3) and thicknesses (mm): 1—◊ (18 kg/m3–40 mm), 2—∆ (18 kg/m3–60 mm), 3—○ (40 kg/m3–40 mm), 4—□ (40 kg/m3–60 mm).

