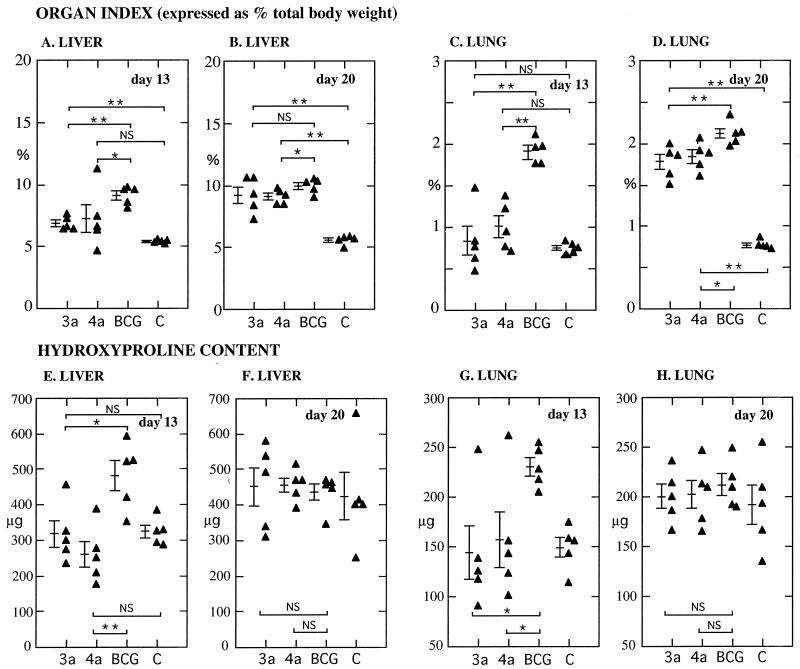
FIG. 5.
Pathology in mice infected with rBCG. (A to D) Organ indices (organ weight expressed as a percentage of total body weight) for the lungs and liver of mice infected for 13 or 20 days with different rBCG constructs (C, saline control). On day 13, organ weights were significantly lower for mice infected with LAP-expressing constructs. (E to H) Similarly, hydroxyproline content—expressed as micrograms per organ—was lower for LAP-BCG constructs on day 13. P values were <0.05 (single asterisks) and <0.005 (double asterisks); NS, not significant. Bars show means and standard errors.

