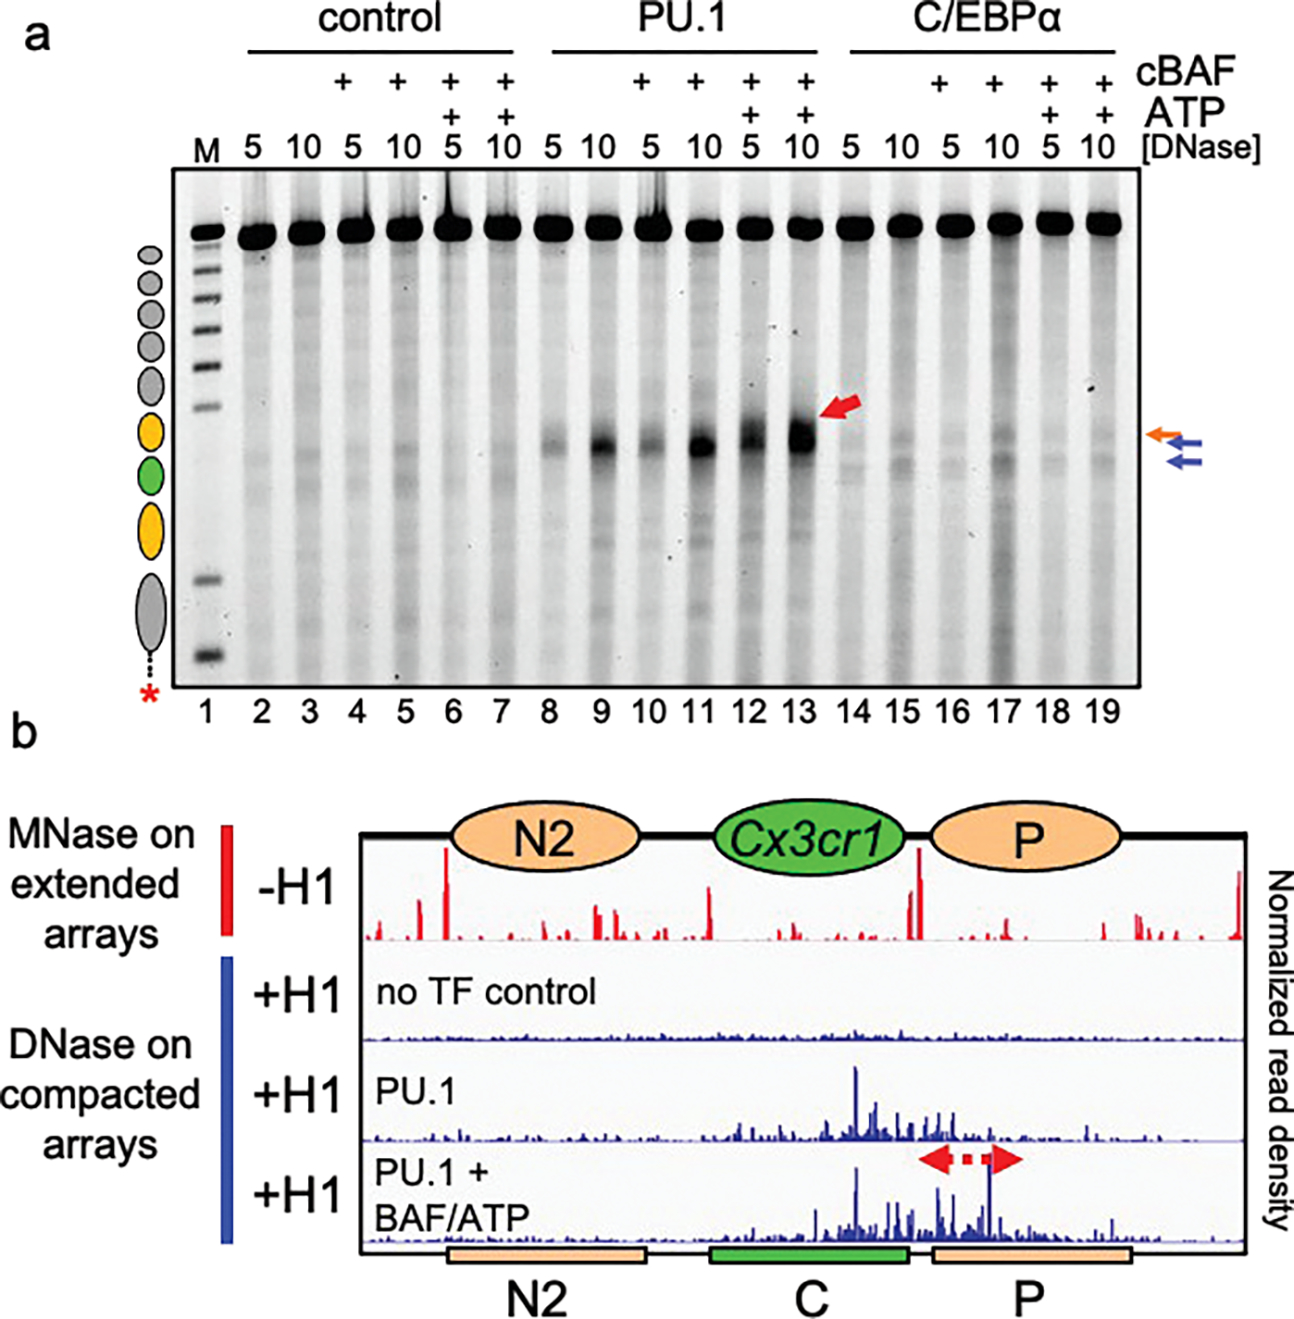
Figure 3: PU.1 Enables further chromatin opening by cBAF.

a, DNase I digestion analysis H1-compacted nucleosome arrays incubated with PU.1 (lanes 8–13) or C/EBPα (lanes 14–19), in the presence of cBAF alone (lanes 10–11 and lanes 16–17, respectively) or cBAF and ATP (lanes 12–13 and lanes 18–19, respectively). b, Nanopore analysis of MNase digested extended arrays (−H1) and DNase I digested compacted arrays (+H1) alone (no TF control), with PU.1 alone, or with PU.1, cBAF and ATP. Ovals indicate the translational positions of nucleosomes determined in Extended Data Fig. 2d. Plots show normalized read density on the y axis. For each plot, the maximum value is set to 0.4% of reads.
