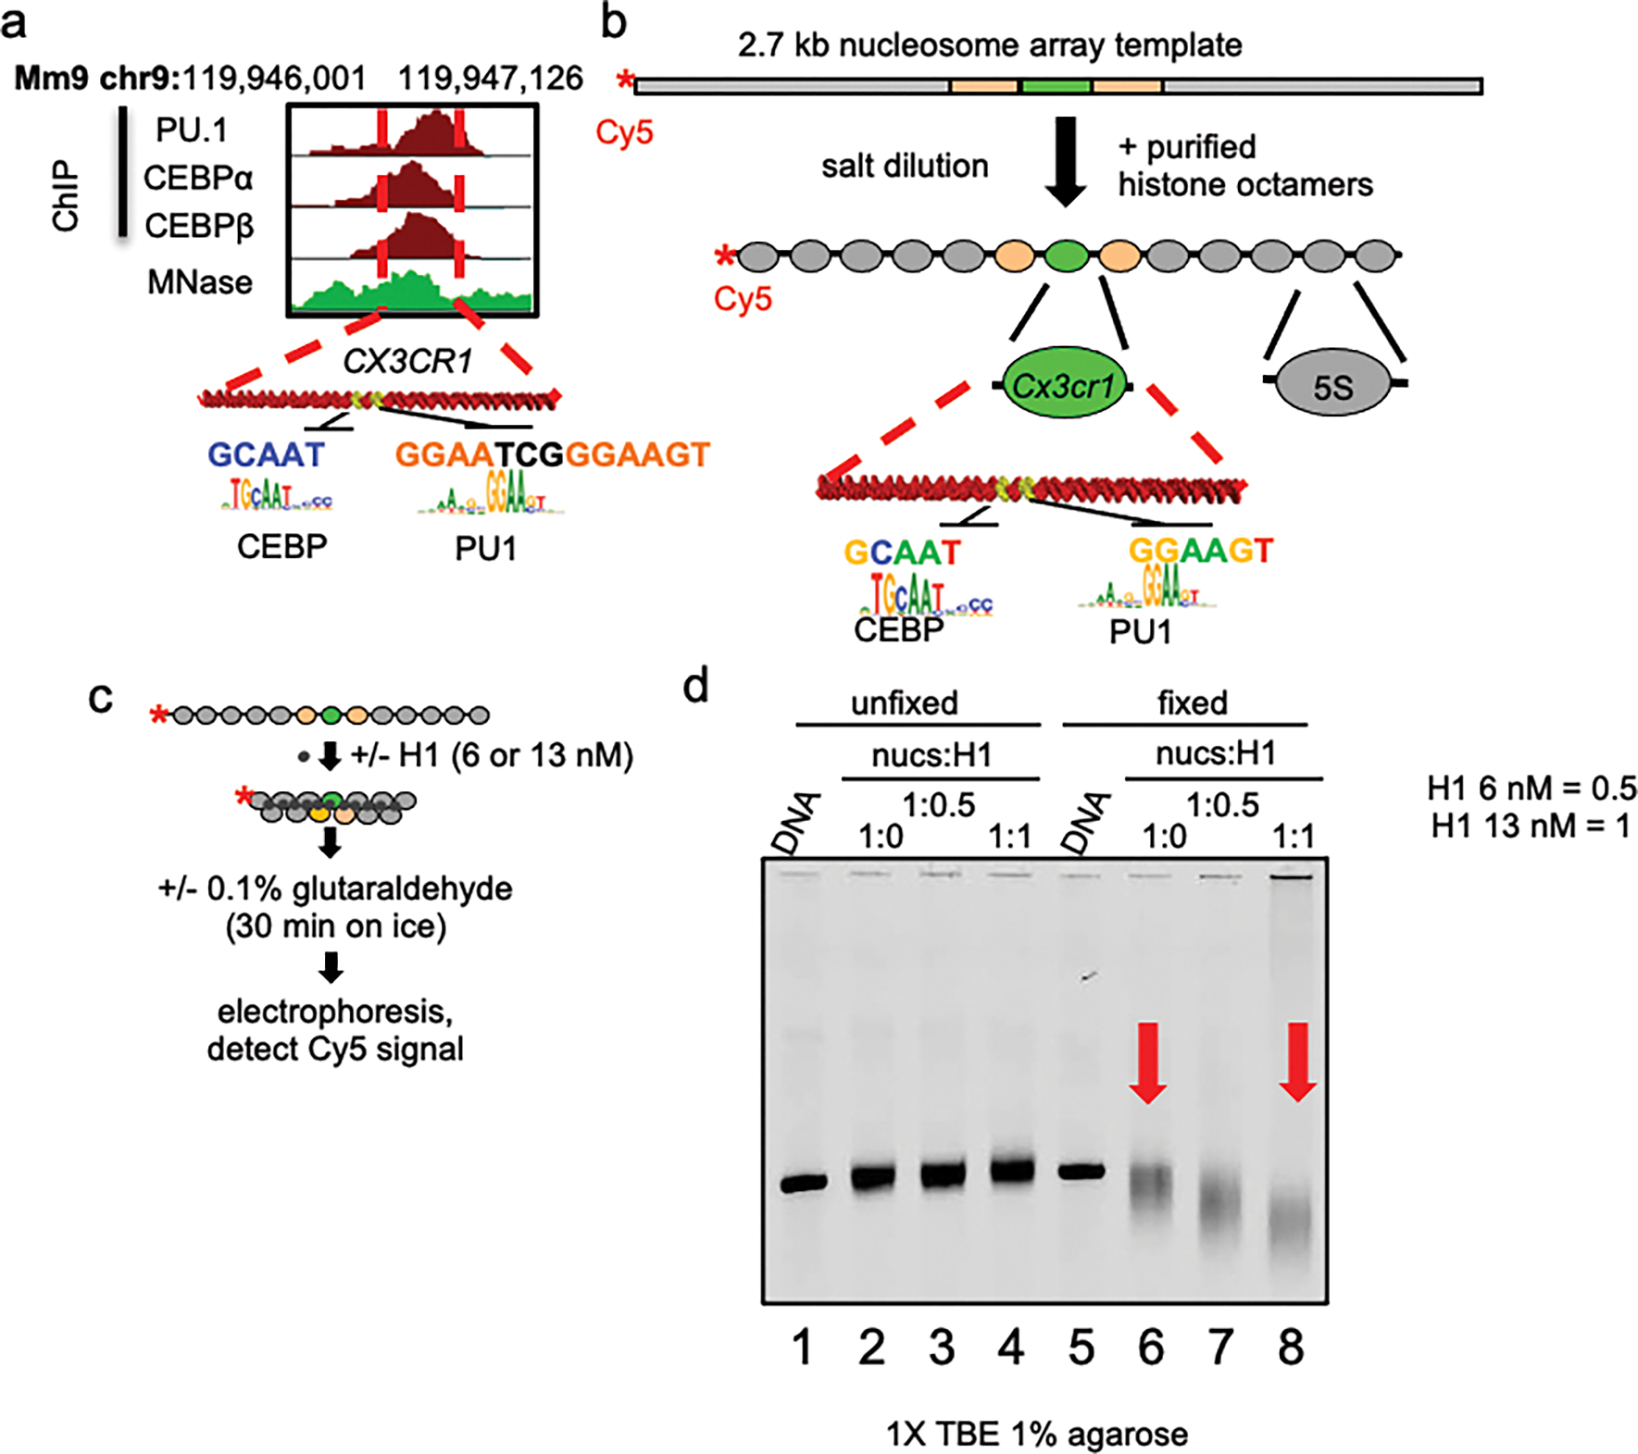
Extended Data Figure 1: Generation of H1-compacted Cx3cr1 nucleosome arrays.

a, PU.1 and C/EBP ChIP-seq profiles (red) in macrophages and MNase-seq profile (green) in fibroblasts near the Cx3cr1 gene within the displayed region of the mouse genome with TF motifs indicated. b, Diagram of the dCTP-Cy5 end-labeled Cx3cr1 nucleosome array. c, Schematic of linker histone-mediated chromatin compaction. d, Analysis of linker histone-mediated chromatin compaction by native agarose gel electrophoresis. Free DNA (lanes 1 and 5) and nucleosome arrays with nucleosome:linker histone ratios of 0 (lanes 2 and 6), 0.5 (lanes 3 and 7) and 1.0 (lanes 4 and 8) are shown.
