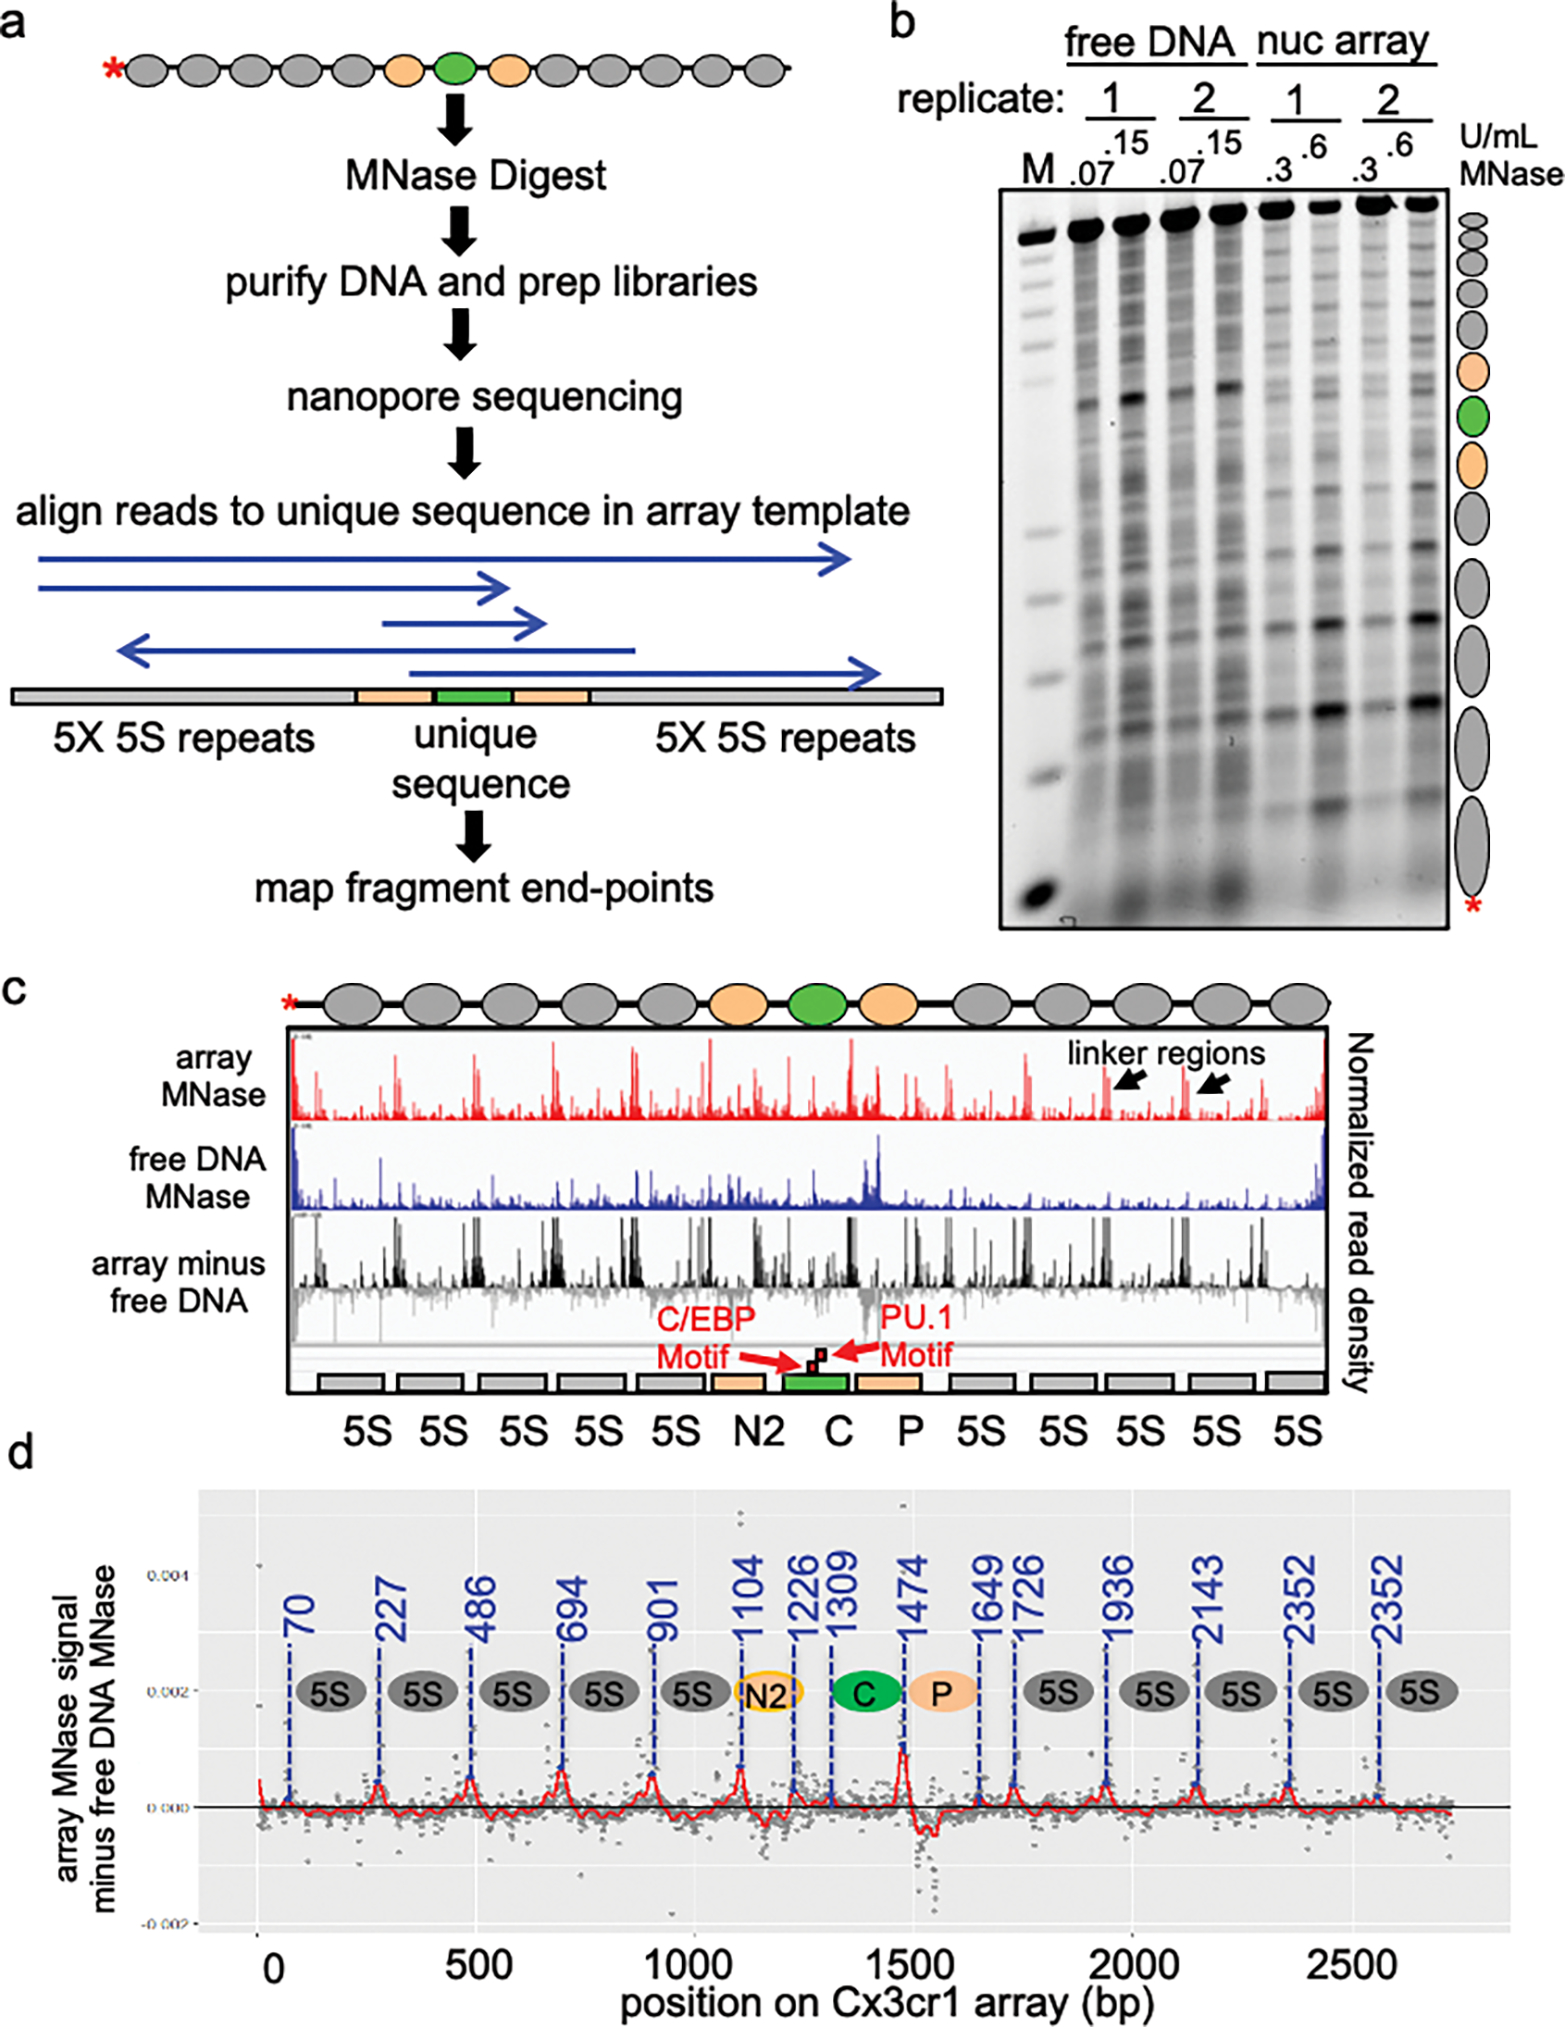
Extended Data Figure 2: Nanopore sequencing to determine translational position of nucleosomes in the Cx3cr1 array.

a, Schematic of Nanopore sequencing and endpoint analysis pipeline. b, MNase digestion analysis of free DNA and extended nucleosome arrays at two MNase concentrations (U/mL) visualized by gel electrophoresis. Reactions shown in this gel are the same ones analyzed by nanopore sequencing. c, IGV visualization of Nanopore sequencing endpoint analysis of MNase digested free DNA (0.07 U/mL MNase), extended nucleosome arrays (0.3 U/mL) and free DNA signal subtracted from array signal to account for MNase site bias. Plots show normalized read density on the y axis. For each plot, the maximum value is set to 0.4% of reads. d, Determination of nucleosome translational positions.
