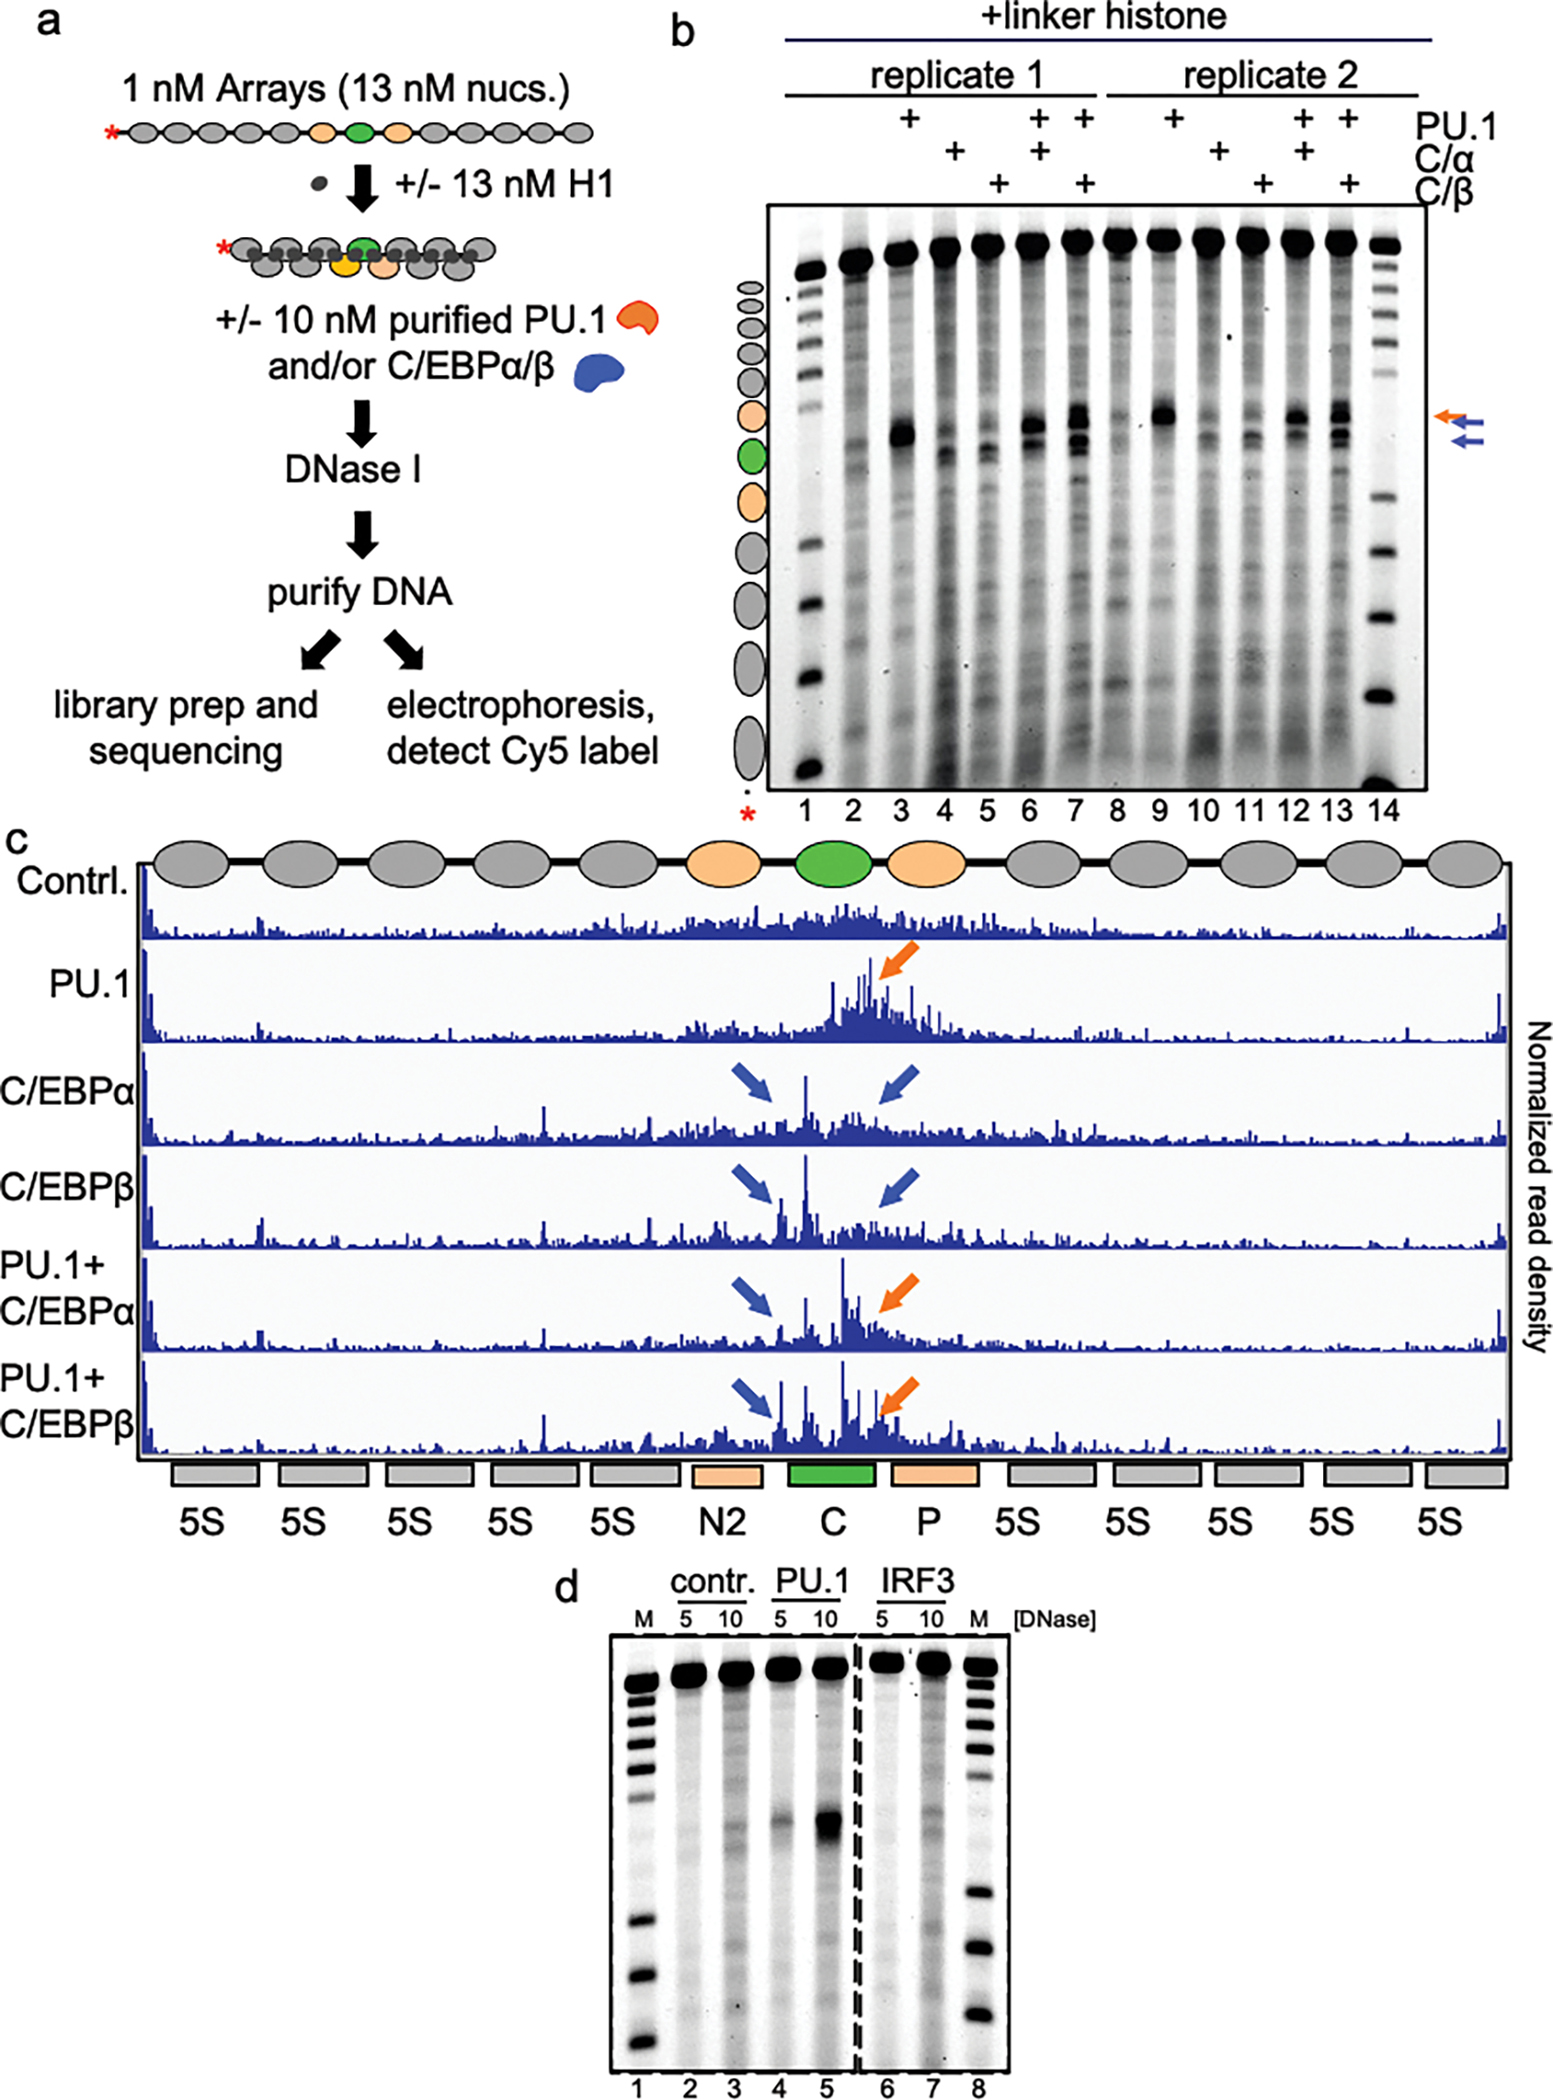
Extended Data Figure 3: Nanopore sequencing of TFs incubated with H1-compacted arrays.

a, Schematic of DNase I digestion analysis. b, DNase I digestion analysis of TFs binding to H1-compacted nucleosome arrays visualized by gel electrophoresis (10 ng/uL DNase I). The same samples shown on the gel were used for nanopore sequencing shown in panel c. c, IGV visualization of Nanopore endpoint analysis of DNase I digested H1-compacted nucleosome arrays incubated with indicated transcription factor(s). Plots show normalized read density on the y axis. For each plot, the maximum value is set to 0.4% of reads. d, DNase I digestion analysis of indicated TFs binding to H1-compacted nucleosome arrays visualized by gel electrophoresis.
