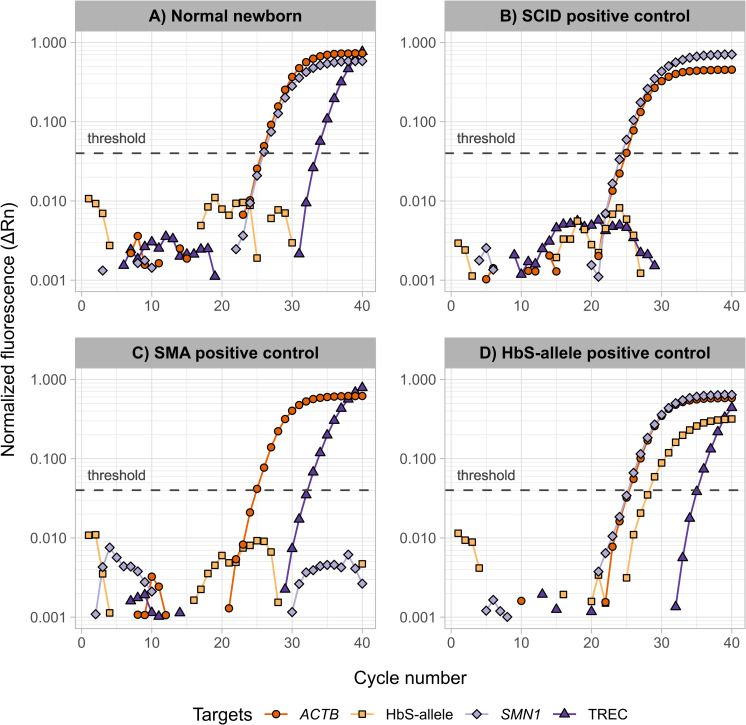
Fig 1. Amplification plots for the fluorescent probes representing the four targets ACTB, HbS allele, SMN1, and TREC in samples of four different physiological conditions.
(A) A normal newborn, or screening negative, sample showing a normal amplification of ACTB, SMN1, and TREC, and no amplification of the HbS allele; (B) a reference SCID positive sample showing no TREC amplification; (C) a reference SMA positive sample with no SMN1 amplification; (D) a sample showing HbS amplification indicating the allele presence. The figure was created using R (v. 4.1.2), ggplot2 (v. 3.3.5), dplyr (v. 1.0.7).

