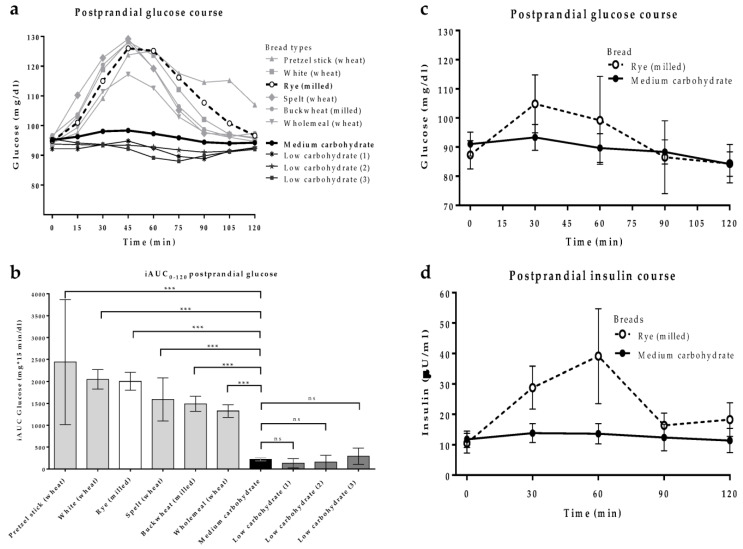
Figure 1.
Postprandial glucose and insulin responses in the pre-tests. Participants (n = 6) consumed 50 g of ten different study breads on separate days after an overnight fast. (a) Mean glucose values measured by continuous glucose monitoring and (b) corresponding area under the curve for 0–120 min (mean ± SD). Mann–Whitney test was used for determining inter-group differences, *** p < 0 001. Participants (n = 6) consumed 50 g of the milled whole grain rye bread and of the medium-carbohydrate bread on consecutive days after an overnight fast and venous blood was collected every 30 min for 120 min. (c) Postprandial course of mean ± SEM blood glucose levels and (d) corresponding course of mean ± SEM blood insulin levels.

