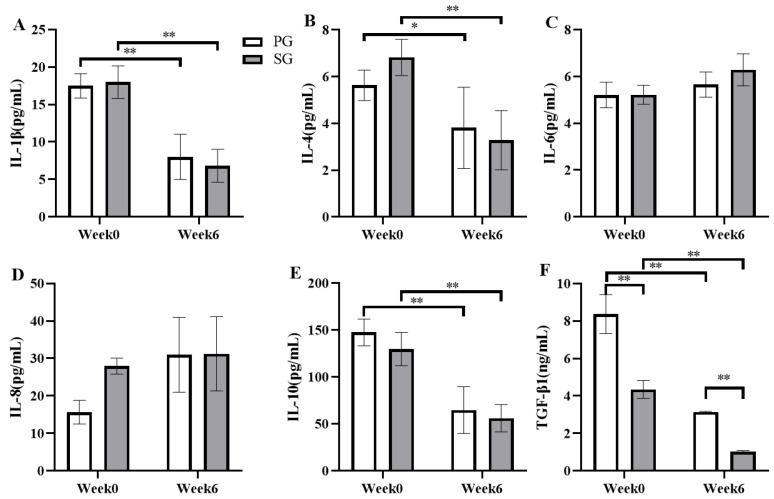
Figure 5.
Comparison of the effects of the prebiotic and synbiotic on serum cytokine concentration immediately after the constant load test in elite football players. Results are presented as mean ± SEM. PG: prebiotic group (n = 15); SG: synbiotic group (n = 15). (A) IL-1β concentration. (B) IL-4 concentration. (C) IL-6 concentration. (D) IL-8 concentration. (E) IL-10 concentration. (F) TGF-β1 concentration. *: p < 0.05; **: p < 0.01.

