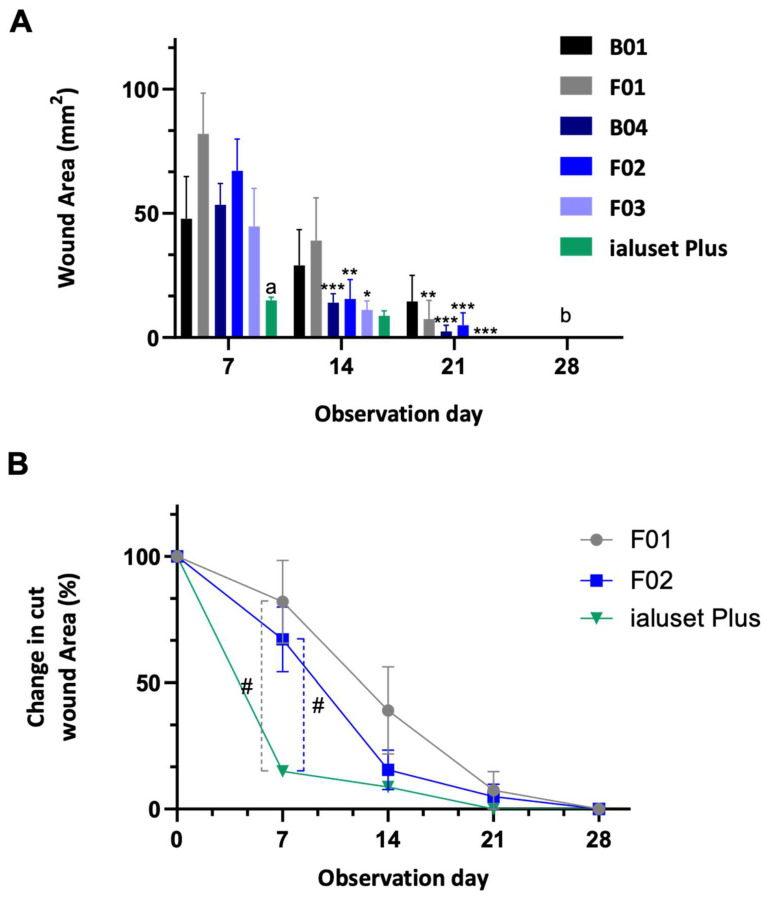
Figure 7.
Retraction of cut wound area; 100% represents the baseline of the cut area at the start of the dosing period. Data represented as mean ± SEM (n = 7). *, **, ***: Statistical difference in comparison to day 7 with p-values < 0.05, < 0.01, < 0.001, respectively. (A) Statistical difference (p-value < 0.05) between wound mass of ialuset Plus at each observation day and all formulations at day 7. (B) all wound masses were significantly retracted in comparison to previous days, p-value < 0.01. #: significant.

