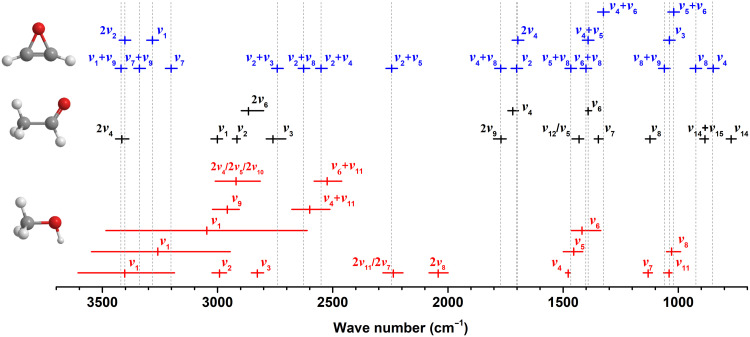
Fig. 3. Peak absorptions (solid vertical lines) and absorption ranges (solid horizontal lines) of methanol (CH3OH, red), acetaldehyde (CH3CHO, black), and oxirene (c-C2H2O, blue).
Dotted vertical lines indicate the overlap between the absorption peaks of oxirene and reactants (CH3OH, red; CH3CHO, black). Detailed absorptions and assignments for experimentally measured pure methanol and acetaldehyde ices as well as calculated oxirene are listed in table S4.

