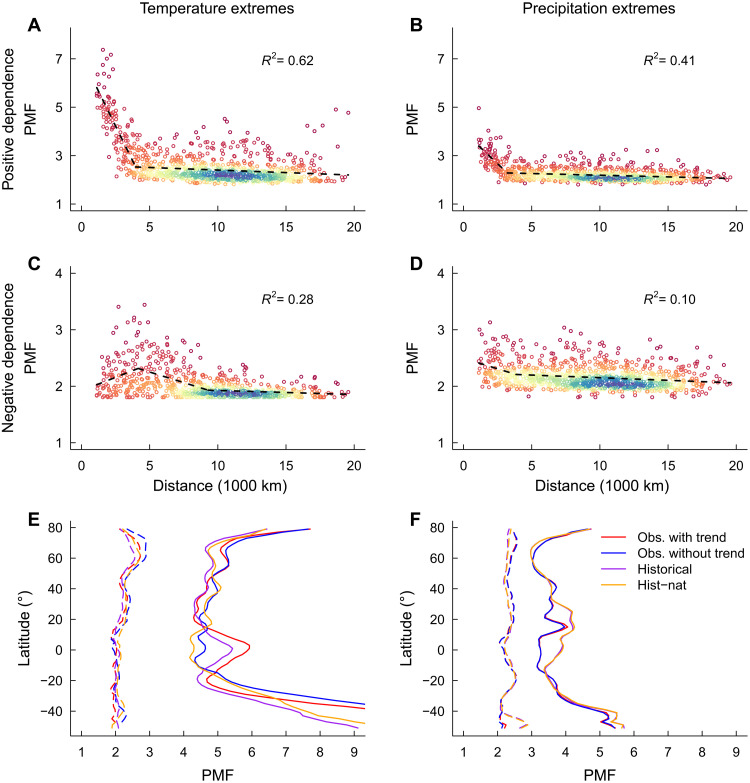
Fig. 3. Geographical distributions of spatially concurrent climate extremes.
(A to D) Decrease in regional PMF of climate extremes with increase in the distance between the centers of each region pair based on observations during 1901–2020. Center location of these AR6 regions is listed in table S2. The spectral color shows the density of points, with higher density in blue/purple and lower density in red. The coefficient of determination (R2) for the segmented linear regression is shown for each panel. (E and F) Latitudinal distributions of PMF for climate extremes using observations with and without long-term trends and the historical and hist-nat simulations from CMIP6 during 1901–2020. The latitudinal distribution is represented by the mean PMF between grid cell pairs within each 10° moving zonal band at 2° increment (Materials and Methods). The solid and dashed lines refer to positively and negatively dependent climate extremes, respectively.

