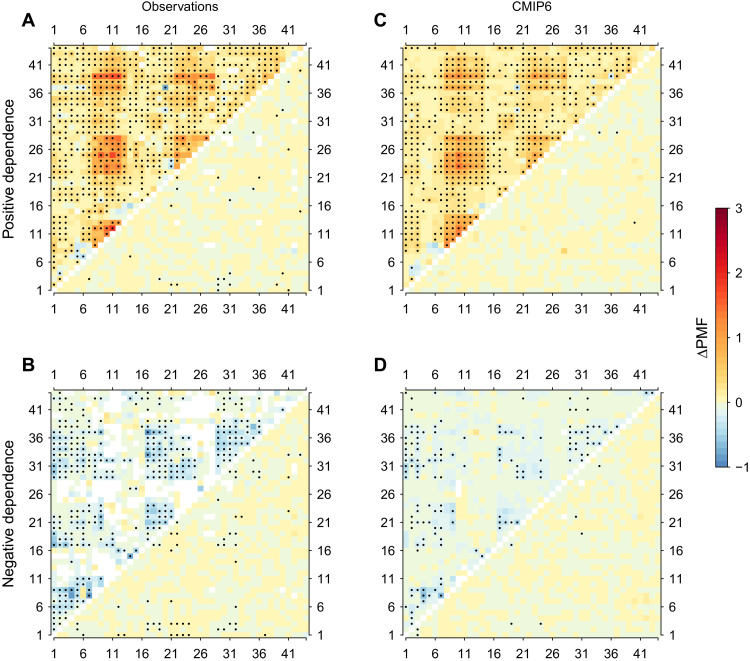
Fig. 4. Influence of anthropogenic climate change on PMF in observations and CMIP6.
(A and B) Difference in regional PMF between observations with (Fig. 2, B and C) and without (fig. S5, B and C) long-term trends for positively (A) and negatively (B) dependent climate extremes (top-left triangle, temperature extremes; bottom-right triangle, precipitation extremes) during 1901–2020. Stippling denotes that the difference in PMF is significant at the 95% confidence level (Student’s t test), and the sign of the difference is the same for all datasets. (C and D) Same as (A) and (B) but for the difference between historical (Fig. 2, D and E) and hist-nat (Fig. 2, F and G) simulations for positively (C) and negatively (D) dependent climate extremes during 1901–2020 based on 11 GCMs in CMIP6. Stippling denotes that the difference in PMF is significant at the 95% confidence level (Student’s t test), and the sign of the difference is consistent with the sign of multimodel means (as shown in the figure) for at least 9 of the 11 GCMs.

