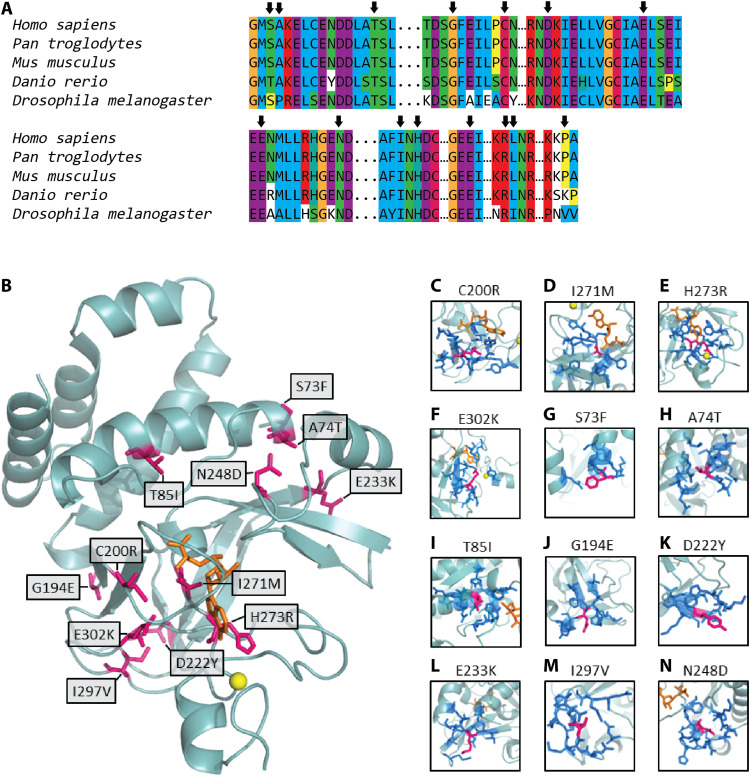
Fig. 4. Structural analyses of KMT5B variants.
In (A), we evaluated the evolutionary conservation of the residues altered by the missense variants in our cohort. Arrows indicate the locations of the missense variants. In (B), we show the location of the missense variants (pink) in the structure of the SET domain of KMT5B (light blue ribbon). The cofactor SAM is shown in orange, and the zinc atom is shown as a yellow sphere. (C to N) Local environment of each variant residue (pink). Neighbors (dark blue) are defined as those residues with at least one interatomic contact (atom-atom distance, <5 Å) with the variant residue. A homology model was built and used for each variant.

