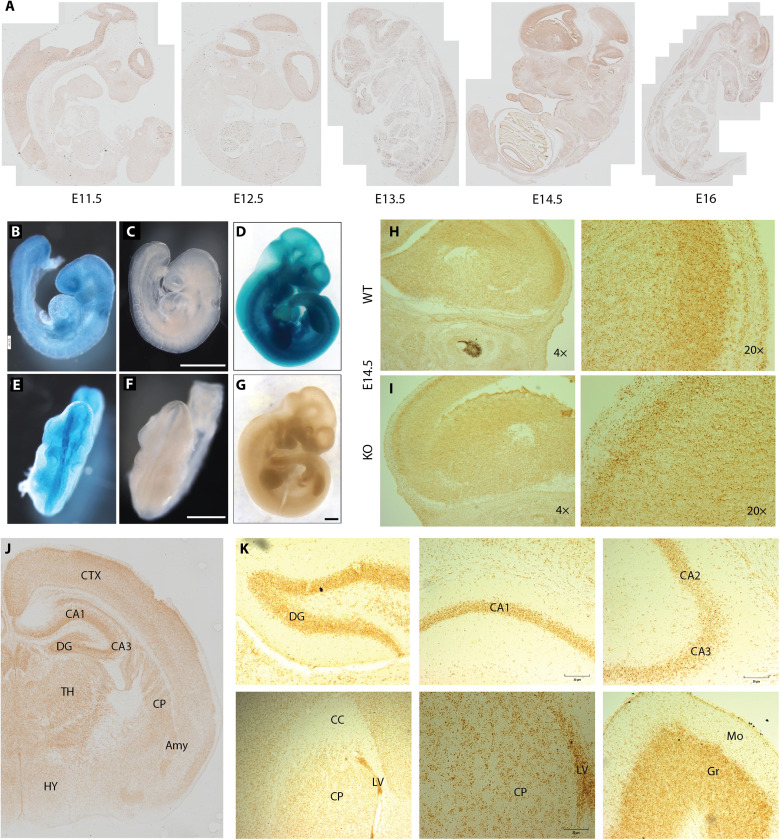
Fig. 5. Expression of Kmt5b over mouse development.
(A) RNAscope in situ hybridization using a Kmt5b probe is shown in representative samples over an embryonic developmental time course (E11.5 to E16). (B to G) Whole-mount β-galactosidase staining of HET (B to D) or WT (E to G) embryos at E8.75 (B, C, E, and F) and E10.5 (D and G). Scale bars, 0.8 mm. Matched Kmt5b RNAscope images are shown in E14.5 (H) WT and (I) KO brains at 4× and 20× resolution. Representative regions from RNAscope on postnatal brains collected at (J) P1 to P2 and (K) P56 are shown. Qualitative Kmt5b expression is compared in tables S3 and S4. DG, dentate gyrus; CA, hippocampal fields 1, 2, and 3; CC, corpus callosum; LV, lateral ventricle; CP, caudoputamen; Mo, molecular layer; Gr, granular layer; CTX, cortex; TH, thalamus; HY, hypothalamus; Amy, amygdala.

