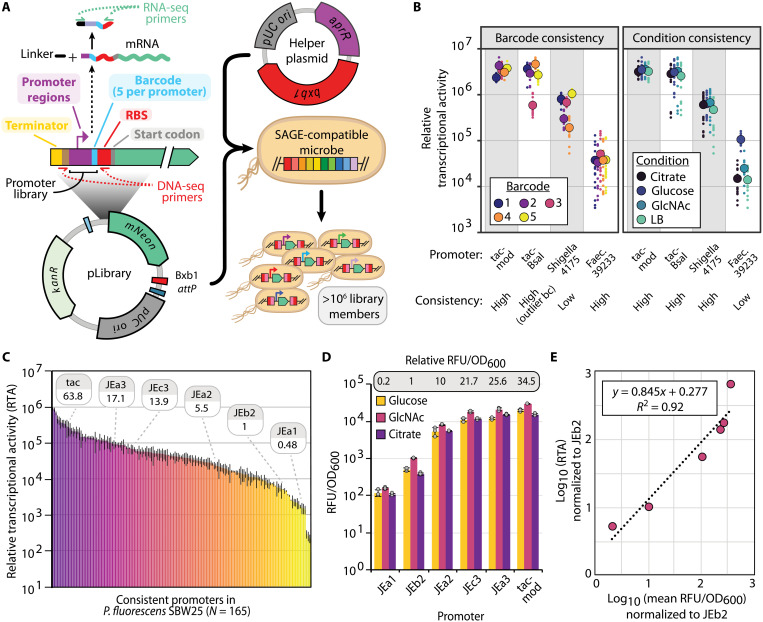
Fig. 5. Development and high-throughput analysis of genome-integrated promoter libraries.
(A) Overview of promoter library construction and DNA/RNA sequencing (RNA-seq) barcode sequencing fragments. (B) Example promoters with different classes of 5′UTR (level of barcode-associated “noise”) and condition sensitivity. Large, outlined circles represent mean values, and small dots represent individual samples. (C) Chart displaying mean RTA for consistent (5′UTR and condition insensitive) promoters in P. fluorescens SBW25. Relative strength of the promoters used in (D) is indicated. Error bars represent two-sided SD of between 36 and 80 samples (see source data file and Supplementary File D1 for exact numbers). (D) Promoter performance for a small subset of pLibrary promoters in microtiter plate growth assays. Error bars represent two-sided SD in three replicates. Relative promoter activity is calculated by comparing mean RFU/OD600 values across all carbon sources. (E) Correlation between relative expression levels determined by RTP and fluorescent protein reporter assay for the set of promoters used in (D). Linear equation and coefficient of determination between the same promoters using RTA data from (C) and fluorescent plate reader data from (D), as determined by Pearson correlation.

