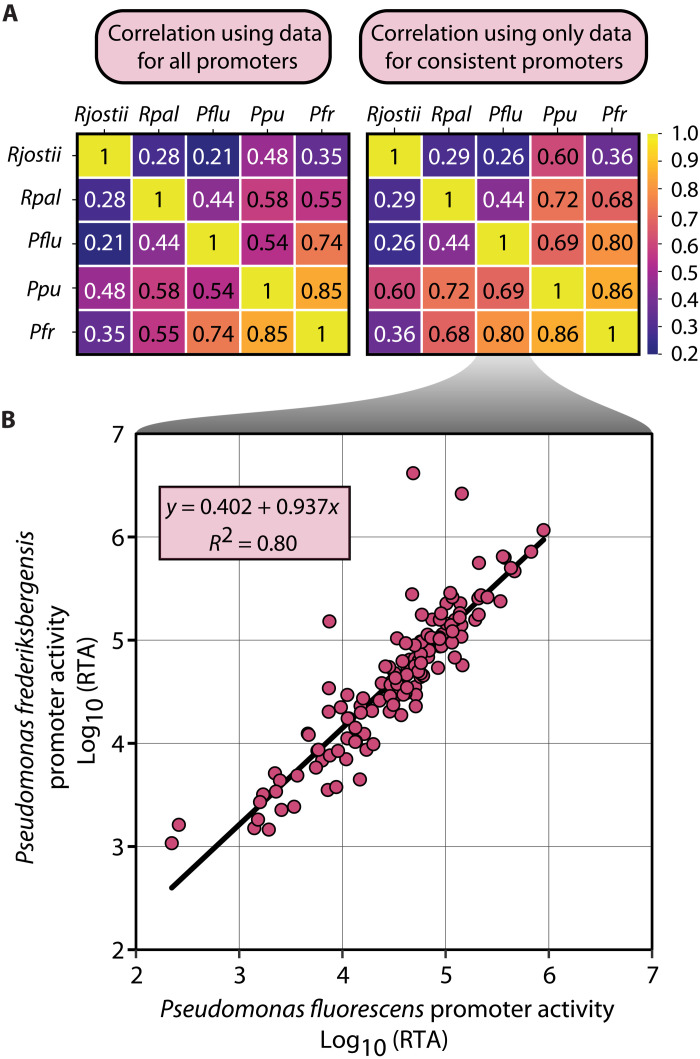
Fig. 6. Promoter activity correlates with phylogenetic distance.
(A) Coefficient of determination (R2) generated when comparing RTA of promoters between promoters that are characterized in each organism pair. R2 values are provided for both sample sets including all promoters or for a subset of promoters that only includes promoters that were consistent in both organisms. (B) Example scatterplot of data used to perform Pearson correlation and the linear equation and coefficient of determination generated using Pearson correlation using consistent promoters from P. fluorescens and P. frederiksbergensis.

