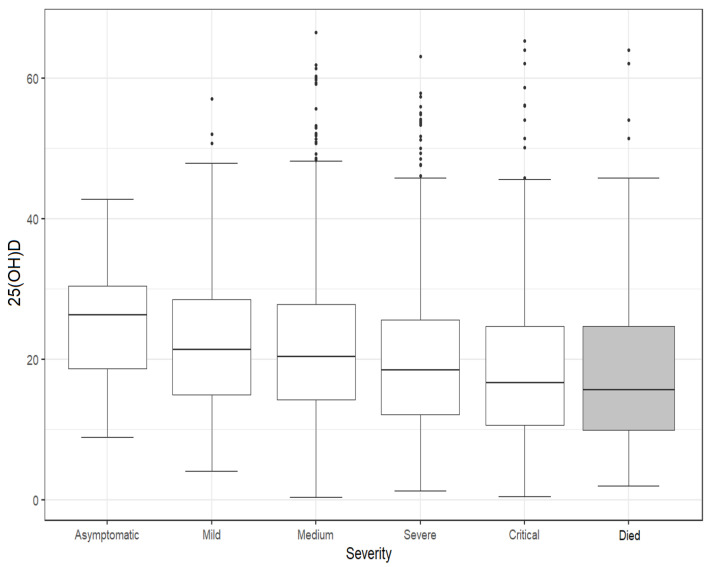
Figure 2.
The 25(OH)D serum concentration according to COVID-19 severity and death outcome. The patients who died, with different severity forms, are presented in the grey boxplot. The box shows the median value (horizontal rule), along with the 1st and 3rd quartiles of the observed data (top and bottom of box). Each whisker’s length corresponds to values that are up to 1.5 times the range between the quartiles.

