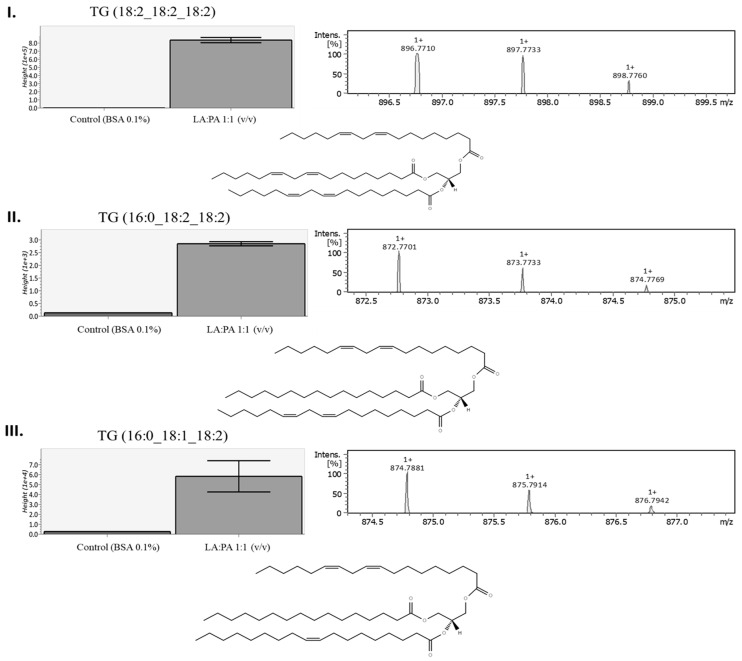
Figure 7.
Boxplot, precursor ion isotopic pattern and molecular structure example of possible identified triglycerides by LC-ESI-qTOF after FFA exposure [control cells vs. LA:PA 1:1 (v/v)]. (I) TG C18:2, C18:2, C18:2; (II) TG C16:0, C18:2, C18:2 and (III) TG C16:0, C18:1, C18:2; FFA: free fatty acids, LA: linoleic acid, PA: palmitic acid. Data treatment was performed using MS-Finder v3.52, MS-Dial v4.90 and LipidMaps®.

